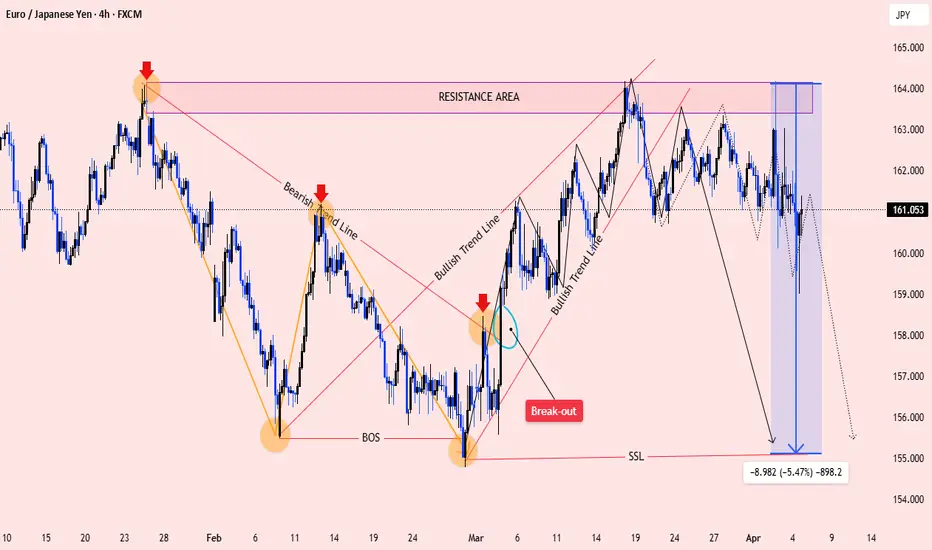
This *EUR/JPY 4H chart* is using a combination of *Smart Money Concepts (SMC)* and *price action tools* to highlight market structure and a potential bearish move. Here's a breakdown of what’s being used:
---
### *1. Market Structure Tools*
- *BOS (Break of Structure)*
Indicates a shift in market structure (from bullish to bearish trend).
- *SSL (Sell-Side Liquidity)*
A key low where liquidity is likely resting (stop losses); marked as a possible target.
---
### *2. Trendlines*
- *Bearish Trend Line*
Connecting lower highs, showing previous bearish momentum.
- *Bullish Trend Lines*
Connect higher lows during the corrective bullish move before the potential reversal.
---
### *3. Resistance Area*
- A horizontal zone marked at the top, showing where price has reversed multiple times — strong supply zone.
---
### *4. Breakout Zone*
- Marked in red as *Break-out*, highlighting a consolidation area that broke down, giving a bearish signal.
---
### *5. Price Projection*
- *Blue Zone with a Down Arrow*
A projected bearish move of about *-5.47%* (around 898 pips), likely targeting the SSL zone.
---
### *6. Double/Triple Top Formation (Implied)*
- The price tested the *resistance area* multiple times without breaking it — suggests distribution and potential reversal.
---
### *7. Visual Tools*
- *Arrows and Circles*
Highlighting important swing highs and lows for structure reference.
- *Colored background*
Enhances clarity between trend phases and key levels.
---
This setup shows a potential *short opportunity* based on trendline breaks, liquidity targeting, and failure to break resistance — a common institutional-style analysis.
Would you like help interpreting the setup further or identifying an entry/exit point based on this?
---
### *1. Market Structure Tools*
- *BOS (Break of Structure)*
Indicates a shift in market structure (from bullish to bearish trend).
- *SSL (Sell-Side Liquidity)*
A key low where liquidity is likely resting (stop losses); marked as a possible target.
---
### *2. Trendlines*
- *Bearish Trend Line*
Connecting lower highs, showing previous bearish momentum.
- *Bullish Trend Lines*
Connect higher lows during the corrective bullish move before the potential reversal.
---
### *3. Resistance Area*
- A horizontal zone marked at the top, showing where price has reversed multiple times — strong supply zone.
---
### *4. Breakout Zone*
- Marked in red as *Break-out*, highlighting a consolidation area that broke down, giving a bearish signal.
---
### *5. Price Projection*
- *Blue Zone with a Down Arrow*
A projected bearish move of about *-5.47%* (around 898 pips), likely targeting the SSL zone.
---
### *6. Double/Triple Top Formation (Implied)*
- The price tested the *resistance area* multiple times without breaking it — suggests distribution and potential reversal.
---
### *7. Visual Tools*
- *Arrows and Circles*
Highlighting important swing highs and lows for structure reference.
- *Colored background*
Enhances clarity between trend phases and key levels.
---
This setup shows a potential *short opportunity* based on trendline breaks, liquidity targeting, and failure to break resistance — a common institutional-style analysis.
Would you like help interpreting the setup further or identifying an entry/exit point based on this?
Disclaimer
The information and publications are not meant to be, and do not constitute, financial, investment, trading, or other types of advice or recommendations supplied or endorsed by TradingView. Read more in the Terms of Use.
Disclaimer
The information and publications are not meant to be, and do not constitute, financial, investment, trading, or other types of advice or recommendations supplied or endorsed by TradingView. Read more in the Terms of Use.