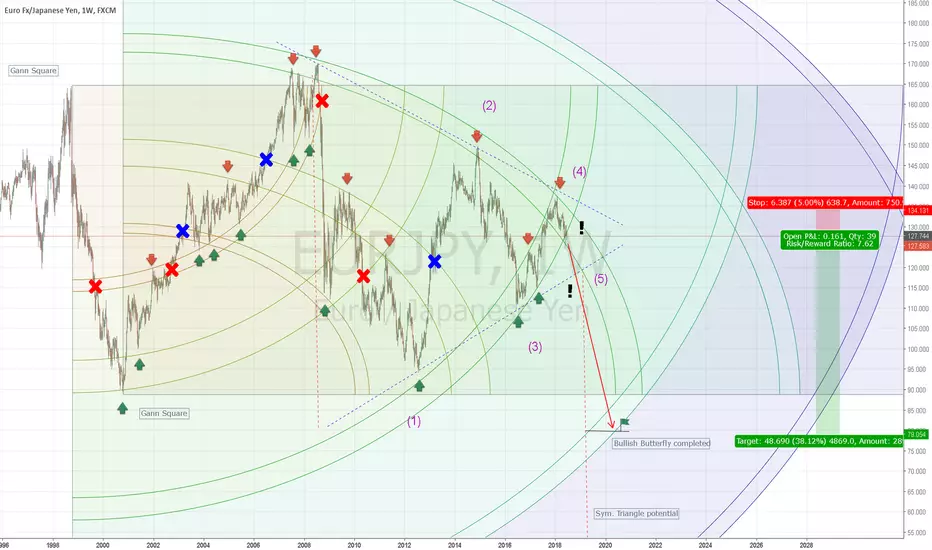
I've been trying Gann Square on EURJPY lately - and it seems like it will continue descending.
Explanation:
- The arcs are working as support and resistance.
- The arrows indicates every time it bounces away from the arcs.
- Red crosses are every time it breaks through the downcending arcs.
- Blue crosses are every time it breaks through the ancending arcs.
It might too early to say, but in the current situation it seems to break through the downcending arc after several testings.
Even though the symmetrical triangle could give us a massive potential, I don't think it will fall that much.
What do you think?
Note
It is more or less outside of the outer arc right now. We should give 1-2 more bars to clarify.Note
Seems like it is tracing the bottom arc. Within 90 days it would be more clearly:) Note
Breaking the upper arc indicates uptrend (Green circle).Note
EURJPY has entered the critical zone and the next days would be important to the next step. Bullish short term:
Entry: 128.7 Target: 134.7. If it breaks the resistance arc it might go further up in the long run!
Bearish long term:
Entry: 128.7 Target: 79 (same as the original idea).
Note
Seems like we are going downards.. But too early to say.Note
It is leaving the arc, but a small pullback might happen next week (Local Cypher Pattern). Note
Possible Scenario?Note
Testing the bottom line again.Related publications
Disclaimer
The information and publications are not meant to be, and do not constitute, financial, investment, trading, or other types of advice or recommendations supplied or endorsed by TradingView. Read more in the Terms of Use.
Related publications
Disclaimer
The information and publications are not meant to be, and do not constitute, financial, investment, trading, or other types of advice or recommendations supplied or endorsed by TradingView. Read more in the Terms of Use.