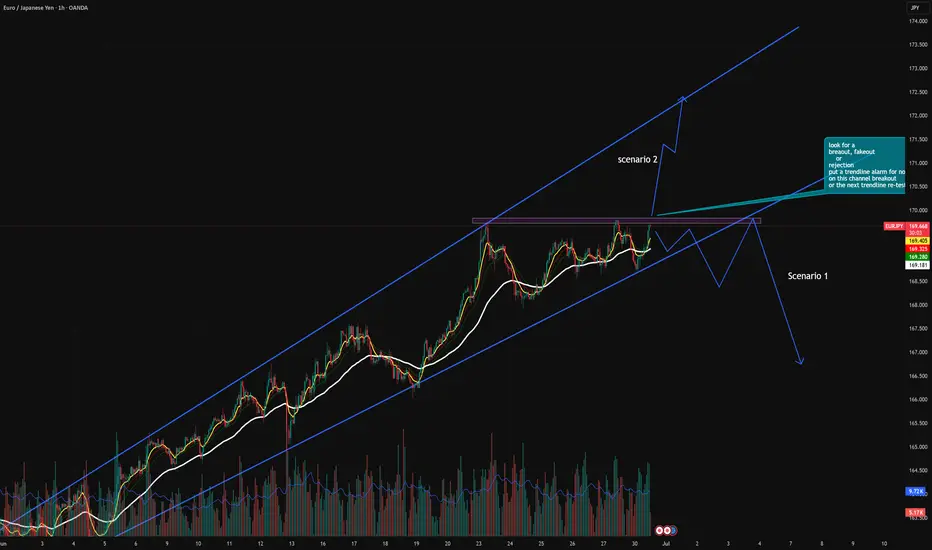
The EUR/JPY pair has been trending steadily inside a well-defined ascending channel, indicating bullish control over the past few weeks. However, price is now approaching a major horizontal resistance zone, aligning with the upper boundary of the channel — a critical area for potential breakout or reversal.
🔍 Chart Structure Breakdown:
🔹 1. Ascending Channel (Trend Continuation Structure)
The pair is respecting both the upper and lower trendlines precisely, forming a bullish parallel channel.
EMAs are aligned bullishly and acting as dynamic support.
Price continues forming higher highs and higher lows, a classic uptrend behavior.
🔹 2. Horizontal Resistance Zone (Purple Box)
The price is currently retesting a key horizontal resistance zone where sellers previously stepped in.
This zone aligns closely with the upper channel boundary, increasing confluence.
We could be witnessing a potential double top or a breakout build-up.
🔹 3. Volume Spike & Buyer Strength
Recent candles show increased volume — a possible signal that institutions are preparing for a larger move.
If volume increases further on breakout, it would confirm continuation.
🧭 Scenarios to Watch:
🟢 Bullish Scenario:
A strong breakout above the purple zone with a full-body candle close could signal:
A breakout from the ascending channel.
Fresh bullish momentum possibly targeting the 170.800–171.500 zone.
Ideal entry: On bullish retest of the breakout zone.
SL below breakout candle; TP at upper Fibonacci extensions.
🔴 Bearish Scenario (Double Top Rejection):
If price rejects the resistance zone again, forming a lower high or engulfing candle:
Expect a short-term pullback toward the midline or lower channel, around 168.500–168.000.
Bearish divergence with RSI or volume may confirm weakness.
This would create a Double Top inside the channel, often leading to a deeper correction.
📌 Conclusion:
EURJPY is at a make-or-break zone. The bullish structure remains intact, but the price must break and hold above the resistance to confirm strength. Until then, this could be a short-term exhaustion point.
🔄 Stay flexible. Watch volume, candle closes, and EMA behavior for confluence on your trade setup.
This analysis and chart work are entirely original and created from my own observations and strategy. Any resemblance to other posts is purely coincidental.
⚠️ Disclaimer:
This analysis is for educational and informational purposes only and does not constitute financial advice or a buy/sell recommendation. All views expressed are my own, based on personal technical interpretation.
DKtrades
Disclaimer
The information and publications are not meant to be, and do not constitute, financial, investment, trading, or other types of advice or recommendations supplied or endorsed by TradingView. Read more in the Terms of Use.
DKtrades
Disclaimer
The information and publications are not meant to be, and do not constitute, financial, investment, trading, or other types of advice or recommendations supplied or endorsed by TradingView. Read more in the Terms of Use.