Hey traders, hope you’re crushing it! 🚀
Spotted a crisp ABC Bullish Symmetry on the EUR/NZD 1-Hour chart—let’s break it down:
🧠 Pattern Breakdown
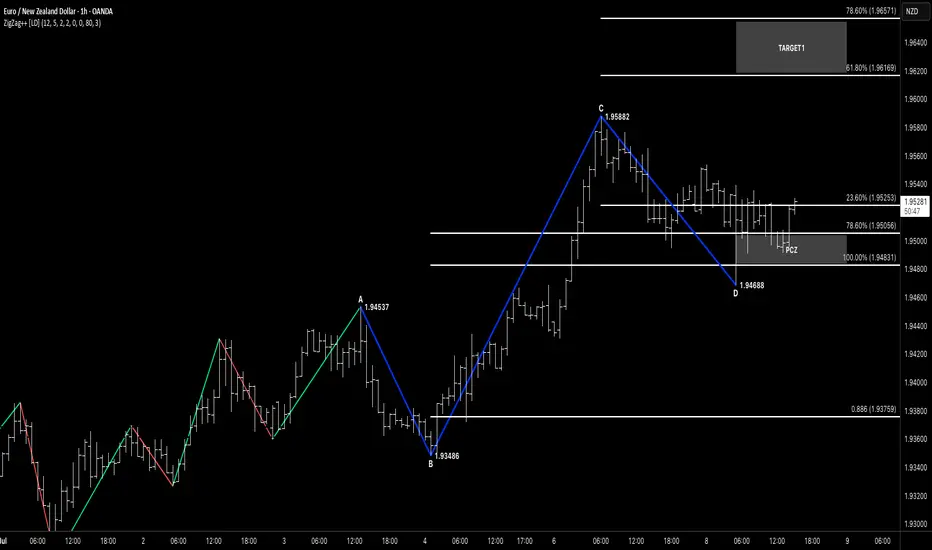
A→B: 1.94537 → 1.93486 (pullback low)
B→C: 1.93486 → 1.95882 (impulse high)
C→D: 1.95882 → 1.94688 (corrective low)
Point D lines up perfectly with the 100% expansion of the A→B move projected off C—textbook harmonic symmetry!
✅ Why This Works
ABC Symmetry: CD ≈ AB in distance
Fib Expansion: D hits the 100% A→B expansion from C
Clear Structure: Strong impulse then neat corrective leg
⚔️ Trade Plan
Trigger: Wait for an hourly close above 23.6% retrace of C→D at 1.95253 to confirm buyers.
Entry Zone: 1.95253–1.94688 (our PCZ + expansion zone)
Stop-Loss: Just below D at 1.94688 (e.g. 1.9455)
Size: Risk 1–2% of your account
🎯 Profit Targets
T1: 61.8% retrace of C→D → 1.96169
T2: 78.6% retrace of C→D → 1.96571
🔍 Confirmation & Invalidation
Confirm: Bullish pin-bar or engulfing candle closing above 1.95253
Invalidate: Price closes below 1.94688 (point D) – scrap the idea
Keep it simple: ABC → 100% Expansion → PCZ → Trigger → Ride.
Respect that stop under D, let price do the talking, and make sure to watch for any EUR/NZD news for extra context. Trade safe and stack those pips! ✌️
Spotted a crisp ABC Bullish Symmetry on the EUR/NZD 1-Hour chart—let’s break it down:
🧠 Pattern Breakdown
A→B: 1.94537 → 1.93486 (pullback low)
B→C: 1.93486 → 1.95882 (impulse high)
C→D: 1.95882 → 1.94688 (corrective low)
Point D lines up perfectly with the 100% expansion of the A→B move projected off C—textbook harmonic symmetry!
✅ Why This Works
ABC Symmetry: CD ≈ AB in distance
Fib Expansion: D hits the 100% A→B expansion from C
Clear Structure: Strong impulse then neat corrective leg
⚔️ Trade Plan
Trigger: Wait for an hourly close above 23.6% retrace of C→D at 1.95253 to confirm buyers.
Entry Zone: 1.95253–1.94688 (our PCZ + expansion zone)
Stop-Loss: Just below D at 1.94688 (e.g. 1.9455)
Size: Risk 1–2% of your account
🎯 Profit Targets
T1: 61.8% retrace of C→D → 1.96169
T2: 78.6% retrace of C→D → 1.96571
🔍 Confirmation & Invalidation
Confirm: Bullish pin-bar or engulfing candle closing above 1.95253
Invalidate: Price closes below 1.94688 (point D) – scrap the idea
Keep it simple: ABC → 100% Expansion → PCZ → Trigger → Ride.
Respect that stop under D, let price do the talking, and make sure to watch for any EUR/NZD news for extra context. Trade safe and stack those pips! ✌️
Disclaimer
The information and publications are not meant to be, and do not constitute, financial, investment, trading, or other types of advice or recommendations supplied or endorsed by TradingView. Read more in the Terms of Use.
Disclaimer
The information and publications are not meant to be, and do not constitute, financial, investment, trading, or other types of advice or recommendations supplied or endorsed by TradingView. Read more in the Terms of Use.