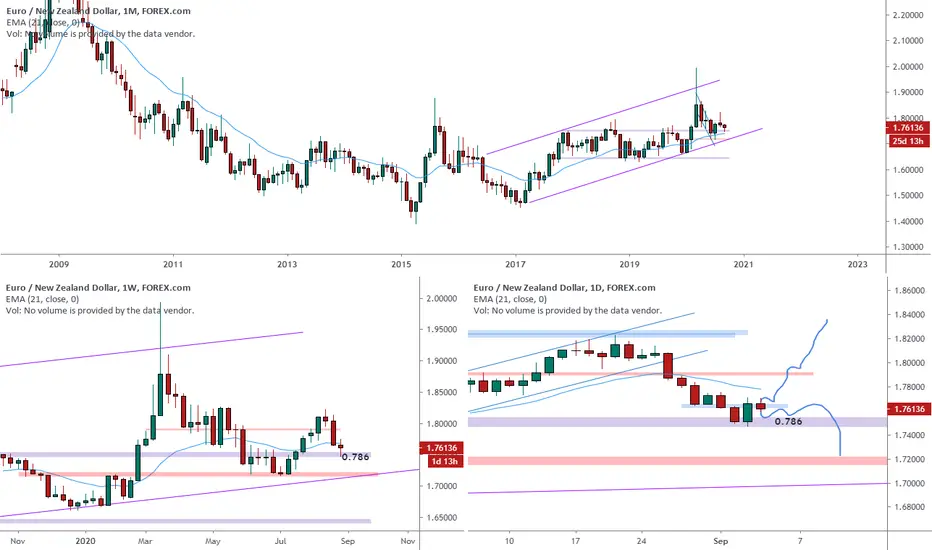
EURNZD on the monthly chart (upper one) has been moved inside an uptrending channel and market now testing the monthly structure (purple).
On the weekly time frame we can notice that after the big spike up the price start a retracement move till the weekly structure (red) and then create a new leg up.
In the lower right chart (daily) market after breaking the minor daily channel create retraced till the 0.786 fib level of the previous move.
AT this level we have 2 possible scenarios, the market could test again and break the monthly structure or start a new move up as in the drawings.
–––––
Follow the Shrimp 🦐
Here is the Plancton0618 technical analysis, please comment below if you have any question.
The ENTRY in the market will be taken only if the condition of Plancton0618 strategy will trigger.
Disclaimer
The information and publications are not meant to be, and do not constitute, financial, investment, trading, or other types of advice or recommendations supplied or endorsed by TradingView. Read more in the Terms of Use.
Disclaimer
The information and publications are not meant to be, and do not constitute, financial, investment, trading, or other types of advice or recommendations supplied or endorsed by TradingView. Read more in the Terms of Use.