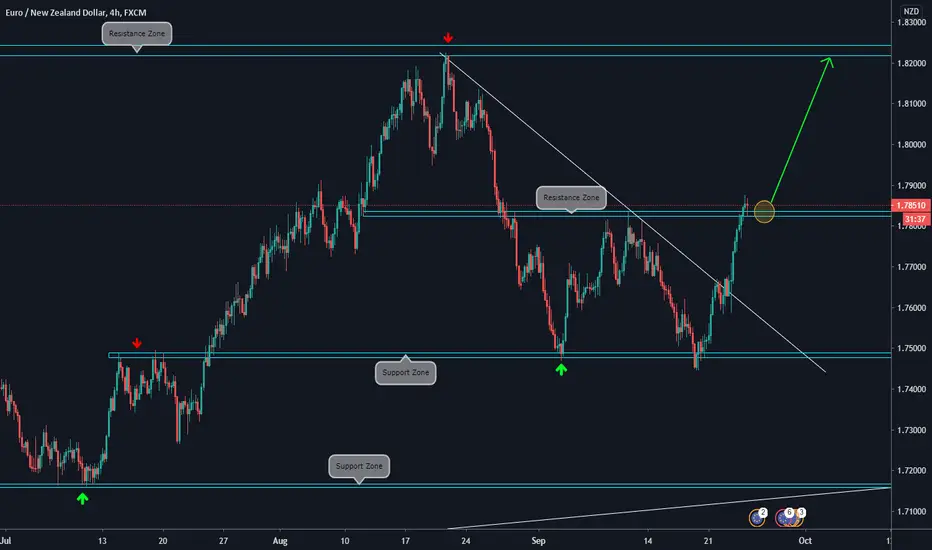
🔸4H CHART EXPLANATION:
.
.
🔸Price made a double bottom pattern and started an upside move.
.
🔸It has broken the Descending Trendline.
.
🔸Now, it has broken the Resistance Zone, so, we consider that this pair has bullish potential towards the next Resistance at 1.8200.
.
🔸 Will look for a lower timeframe bullish setup.
🔸DAILY CHART ANALYSIS:

.
.
🔸Price made a double bottom pattern and started an upside move.
.
🔸It has broken the Descending Trendline.
.
🔸Now, it has broken the Resistance Zone, so, we consider that this pair has bullish potential towards the next Resistance at 1.8200.
.
🔸 Will look for a lower timeframe bullish setup.
🔸DAILY CHART ANALYSIS:
Disclaimer
The information and publications are not meant to be, and do not constitute, financial, investment, trading, or other types of advice or recommendations supplied or endorsed by TradingView. Read more in the Terms of Use.
Disclaimer
The information and publications are not meant to be, and do not constitute, financial, investment, trading, or other types of advice or recommendations supplied or endorsed by TradingView. Read more in the Terms of Use.