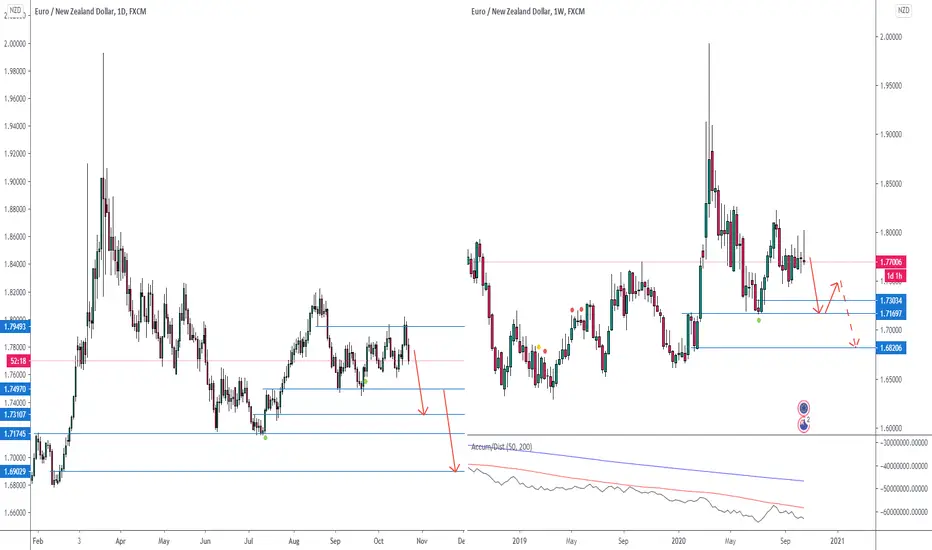
On weekly we can see accumulation below a significant level which suggest price will push further down.
On daily price can pull back up somewhat into last the last 2 days candles (where my red arrow starts) but eventually it will drop.
On daily price can pull back up somewhat into last the last 2 days candles (where my red arrow starts) but eventually it will drop.
Note
Top Absolute Correlation 1 DAY1 EURNZD - NZDCHF -96.0%
2 EURNZD - NZDCAD -87.5%
3 EURNZD - NZDUSD -81.8%
4 EURNZD - GBPNZD 71.3%
5 EURNZD - USDZAR 69.3%
6 EURNZD - EURZAR 69.0%
7 EURNZD - ZARJPY -65.5%
8 EURNZD - XAUAUD 64.5%
9 EURNZD - NZDJPY -64.1%
10 EURNZD - EURAUD 60.1%
Trade closed: target reached
Disclaimer
The information and publications are not meant to be, and do not constitute, financial, investment, trading, or other types of advice or recommendations supplied or endorsed by TradingView. Read more in the Terms of Use.
Disclaimer
The information and publications are not meant to be, and do not constitute, financial, investment, trading, or other types of advice or recommendations supplied or endorsed by TradingView. Read more in the Terms of Use.