📊 General Analysis of EUR/NZD (Higher Timeframe)
1. 📌 Price Context
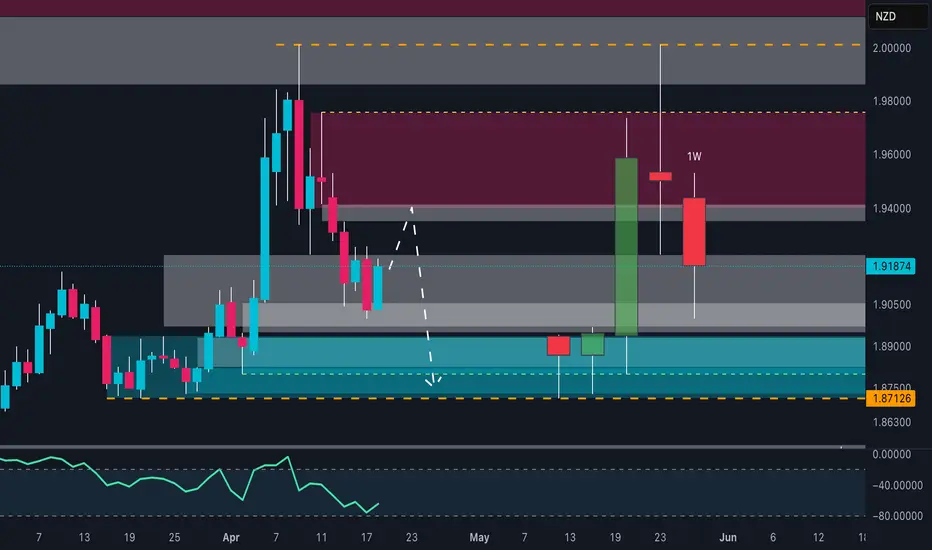
The price had a strong bounce from a demand zone (highlighted in light blue) around 1.85.
It then broke through multiple supply zones (gray and maroon) to the upside and is currently hovering near 1.91874.
🔍 Key Zones
🔵 Demand Zone (Support)
Range: 1.8430 – 1.8712
This zone has been tested multiple times, with long wicks to the downside → indicating strong buying interest.
A powerful bullish move originated from this area.
🔴 Supply Zone (Resistance)
Current resistance: 1.9187 – 1.9450
This is where the price is currently paused → potential rejection area.
Monthly upper zone (1M): 1.96 – 2.00
A strong long-term resistance. If reached, we might see profit-taking or even a reversal.
🕯️ Candles & Momentum
The large green candle represents a strong bullish breakout.
The weekly candle (labeled "1W") shows indecision → this could be a pause before continuation or the beginning of a pullback.
🔮 Possible Future Scenarios
✅ Bullish Scenario
If the price decisively breaks above 1.9187, the next target is 1.9600 – 2.0000.
⚠️ Bearish Scenario
If price gets rejected at current levels, it may fall back into the support zone 1.8712 – 1.8500, which has previously shown strength.
📈 Lower Indicator (Likely RSI or Wavetrend)
Currently bouncing from an oversold area.
No clear overbought signals → there’s room for more upside.
🧭 Conclusion
Current trend: Bullish (especially in the short to mid term).
Key levels to watch:
Resistance: 1.9187 and 1.96–2.00
Support: 1.8712 and 1.85
1. 📌 Price Context
The price had a strong bounce from a demand zone (highlighted in light blue) around 1.85.
It then broke through multiple supply zones (gray and maroon) to the upside and is currently hovering near 1.91874.
🔍 Key Zones
🔵 Demand Zone (Support)
Range: 1.8430 – 1.8712
This zone has been tested multiple times, with long wicks to the downside → indicating strong buying interest.
A powerful bullish move originated from this area.
🔴 Supply Zone (Resistance)
Current resistance: 1.9187 – 1.9450
This is where the price is currently paused → potential rejection area.
Monthly upper zone (1M): 1.96 – 2.00
A strong long-term resistance. If reached, we might see profit-taking or even a reversal.
🕯️ Candles & Momentum
The large green candle represents a strong bullish breakout.
The weekly candle (labeled "1W") shows indecision → this could be a pause before continuation or the beginning of a pullback.
🔮 Possible Future Scenarios
✅ Bullish Scenario
If the price decisively breaks above 1.9187, the next target is 1.9600 – 2.0000.
⚠️ Bearish Scenario
If price gets rejected at current levels, it may fall back into the support zone 1.8712 – 1.8500, which has previously shown strength.
📈 Lower Indicator (Likely RSI or Wavetrend)
Currently bouncing from an oversold area.
No clear overbought signals → there’s room for more upside.
🧭 Conclusion
Current trend: Bullish (especially in the short to mid term).
Key levels to watch:
Resistance: 1.9187 and 1.96–2.00
Support: 1.8712 and 1.85
📈 Nicola | EdgeTradingJourney
Documenting my path to $1M in prop capital through real trading, discipline, and analysis.
Documenting my path to $1M in prop capital through real trading, discipline, and analysis.
Disclaimer
The information and publications are not meant to be, and do not constitute, financial, investment, trading, or other types of advice or recommendations supplied or endorsed by TradingView. Read more in the Terms of Use.