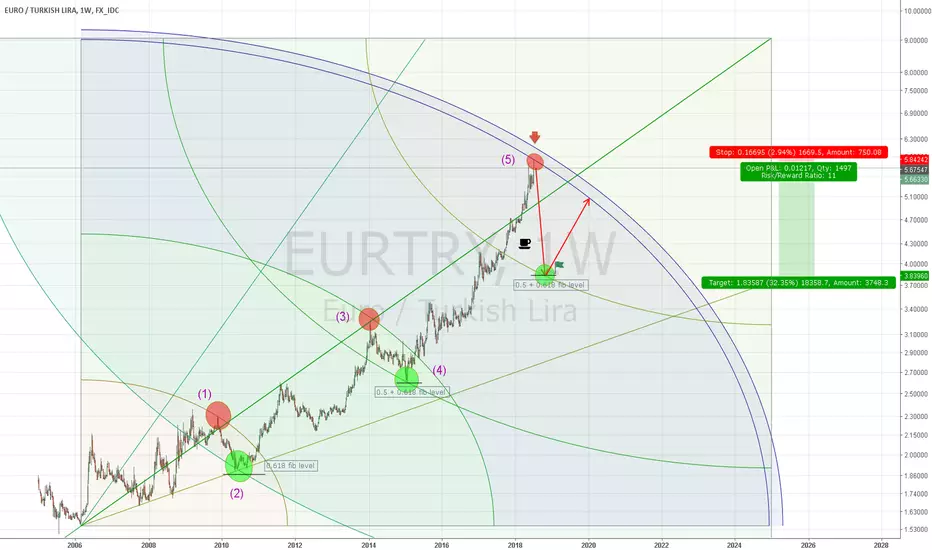
I'm a big fan of Gann Square and here is another idea:
Target: 3,83
When: 1.November 2018
Why:
- Arc number 5 was just completed (the last arc got hit), this indicates a descending path ahead.
- It might go a little further hitting the outer arc and a stop loss in this area would be an alternative.
- EW wave theory fits in.
- Local and global fibonacci level + Gann arc gives us the target.
- The peaks are getting more and more steeper, my gut says it will drop anytime soon:P
Note! This is a log scale chart.
Note
Another argument: Fib channel gives us the same turning point. Note
A close-up gives us this small triangle pattern:Note
A break-out?Note
Just want to show an example of how Divergence also could have been used on this case:Note
Coffee break anyone? Note
Here is my next short term strategi: Note
In this case buy zone means buying more short positions and vica verca.Note
It's is getting critical right now as it is closing in to the "sell zone". It might be a good entry for new positions. Stop loss above the inner arc would be great.Note
It is clearly outside the inner arc, but because of some drawing error it might work still. Here is a last minute entry:Note
Okay, so it didn't go this time... but I'm still bearish in the long run because of the outer arc could be the one. I've drawed some alternative upper lines but those two make them clearly outside the inner arc and then the main idea more unsure. Again, the second attempt would be the outer arc (it might go fast!):
Disclaimer
The information and publications are not meant to be, and do not constitute, financial, investment, trading, or other types of advice or recommendations supplied or endorsed by TradingView. Read more in the Terms of Use.
Disclaimer
The information and publications are not meant to be, and do not constitute, financial, investment, trading, or other types of advice or recommendations supplied or endorsed by TradingView. Read more in the Terms of Use.