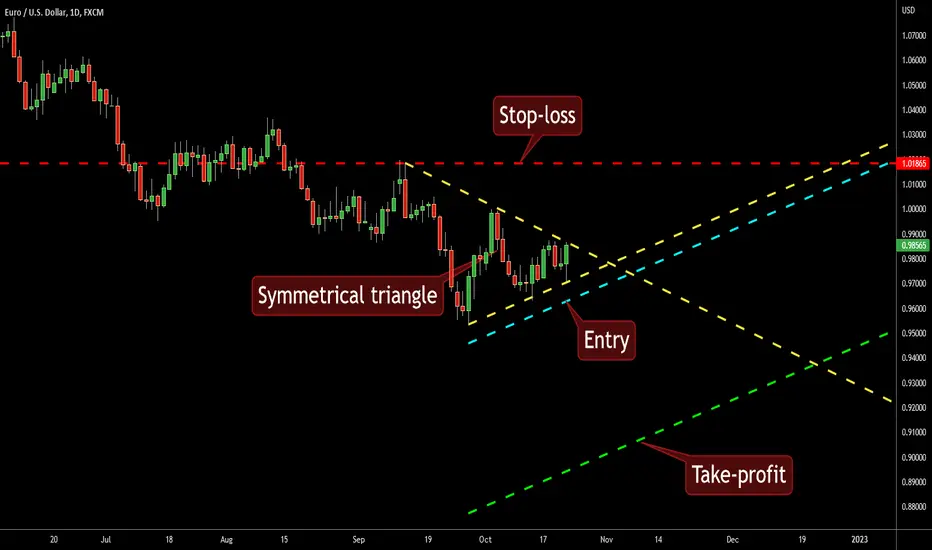
The medium-term consolidation of the EUR/USD currency pair took a form of a symmetrical triangle on its daily chart. This formation can serve as a continuation pattern for a bearish breakout trading opportunity. My potential entry is placed at the cyan line, which is located at 10% of the triangle's base width below the lower border. My take-profit will be at the green line, which is located at 100% of the triangle's base width below the lower border. I will set my stop-loss to the triangle's topmost point (1.01865).
Order cancelled
Trade setup cancelled due to the pattern breaking in the opposite direction.You can find useful tools to detect, build, and trade chart patterns - all completely free on earnforex.com.
Disclaimer
The information and publications are not meant to be, and do not constitute, financial, investment, trading, or other types of advice or recommendations supplied or endorsed by TradingView. Read more in the Terms of Use.
You can find useful tools to detect, build, and trade chart patterns - all completely free on earnforex.com.
Disclaimer
The information and publications are not meant to be, and do not constitute, financial, investment, trading, or other types of advice or recommendations supplied or endorsed by TradingView. Read more in the Terms of Use.