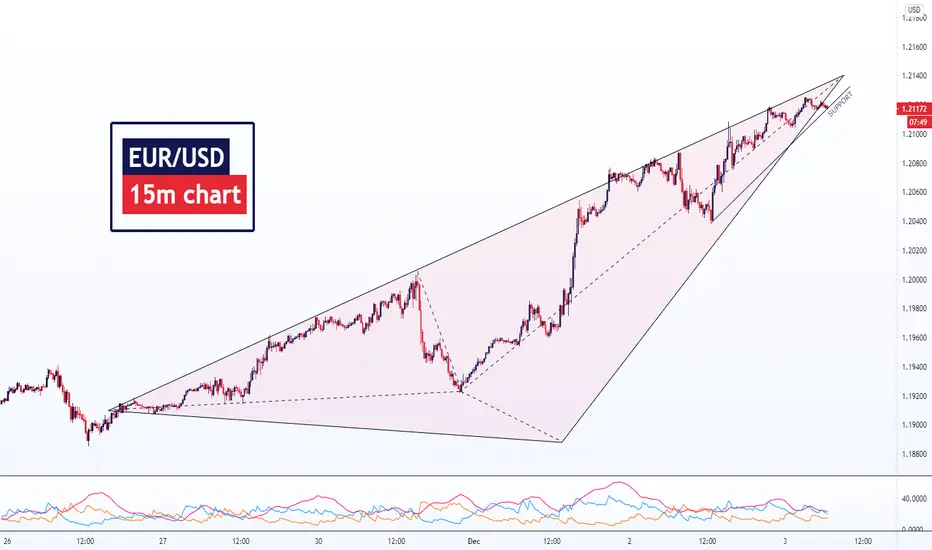
Here, presenting the EUR/USD 15m chart. To make it easy to understand, I have used particular shapes and an indicator. ADX is less than 25, which means a downtrend, but DI+ is above DI- which shows an uptrend. If it crosses the support line, it will fall up to certain levels 1.2090 - 1.2076 - 1.2060. But if it does not break the support line, then the trend will touch the following levels 1.2146 - 1.2160.
Disclaimer
The information and publications are not meant to be, and do not constitute, financial, investment, trading, or other types of advice or recommendations supplied or endorsed by TradingView. Read more in the Terms of Use.
Disclaimer
The information and publications are not meant to be, and do not constitute, financial, investment, trading, or other types of advice or recommendations supplied or endorsed by TradingView. Read more in the Terms of Use.