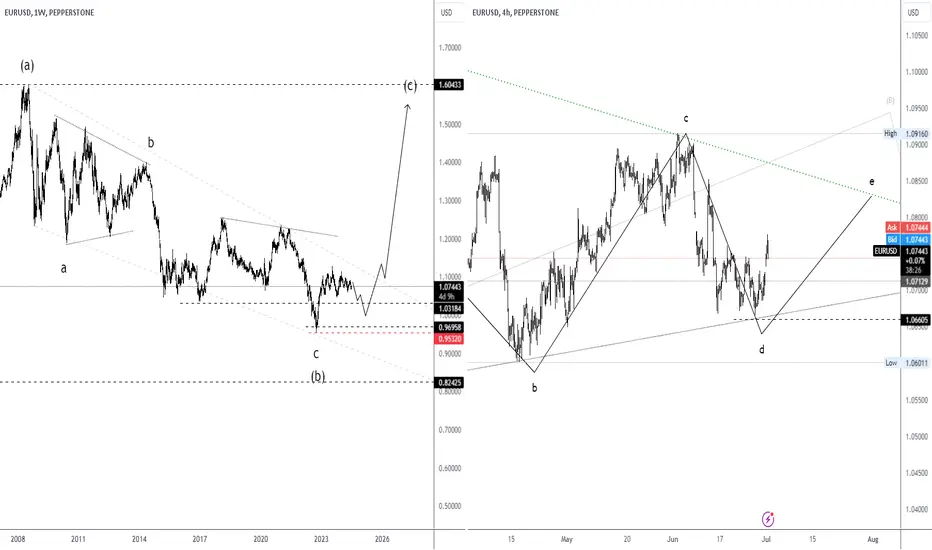
Left chart: Weekly Timeframe
Leg B ends around 0.9532
invalid if the price is below 0.9532
Right chart: 4H
chart try to form an ABCDE pattern.
now heading up to the green dashline
It should drop this zone and form leg c
yes, it can break up if strong bullish trend too
we can see a Diamond pattern in this chart too

Leg B ends around 0.9532
invalid if the price is below 0.9532
Right chart: 4H
chart try to form an ABCDE pattern.
now heading up to the green dashline
It should drop this zone and form leg c
yes, it can break up if strong bullish trend too
we can see a Diamond pattern in this chart too
Disclaimer
The information and publications are not meant to be, and do not constitute, financial, investment, trading, or other types of advice or recommendations supplied or endorsed by TradingView. Read more in the Terms of Use.
Disclaimer
The information and publications are not meant to be, and do not constitute, financial, investment, trading, or other types of advice or recommendations supplied or endorsed by TradingView. Read more in the Terms of Use.