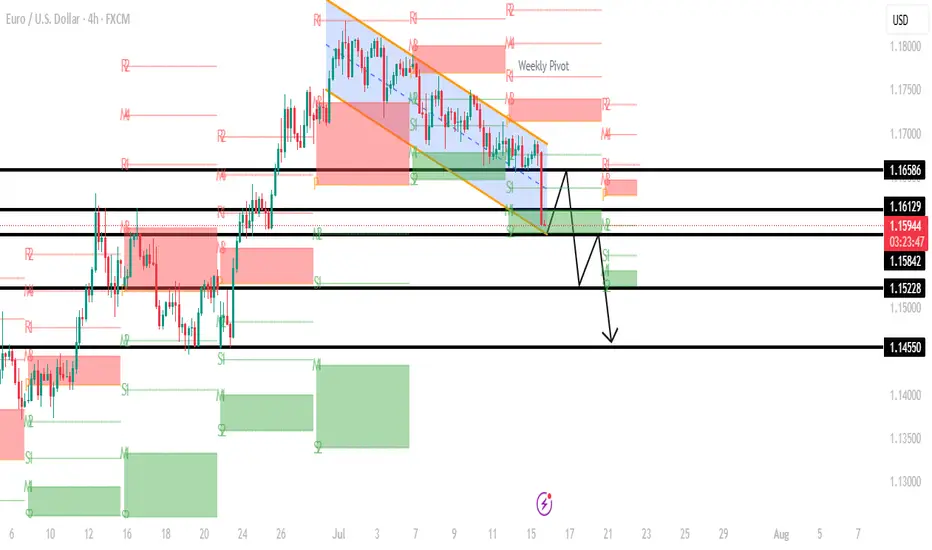
This is a 4-hour chart of the EUR/USD currency pair, and it includes several key technical elements:
---
🔍 Overall Market Context
The price is in a downtrend, clearly shown by the descending channel (highlighted with yellow lines).
The price just broke below the lower boundary of that channel, indicating potential bearish continuation.
The chart includes support/resistance levels, pivot points, and a projected path suggesting possible price behavior.
---
🔧 Key Technical Elements
1. Price Action & Structure
Recent price action shows a strong bearish move (large red candle), suggesting strong selling pressure.
The move bounced off S2, a weekly pivot support level, and entered a demand zone (green area).
2. Projected Scenario (Black Line Path)
A potential pullback to 1.16586 (key resistance).
If price fails to break above that resistance, it's expected to drop again.
Possible next supports:
1.15842
1.15228
Final target: 1.14550
3. Pivot Levels
Weekly Pivot: Near 1.17100 area (currently above the price — bearish implication).
S2 level: Around 1.15900 — presently acting as short-term support.
R1, R2, etc., are above and could act as resistance in a retracement.
---
📊 Summary of Trade Outlook
🔻 Bearish Bias (Short-Term to Medium-Term)
Main idea: This chart reflects a bearish breakout of a descending channel.
Entry Zones: After a potential pullback to resistance (1.16586)
Targets: 1.15842 → 1.15228 → 1.14550
Invalidation: A Bullish break above 1.16586 could invalidate the bearish setup.
---
✅ Trading Considerations
Wait for confirmation of rejection at 1.16129 or 1.16586 before shorting.
Watch for volume confirmation on the pullback.
Monitor fundamentals (e.g. ECB or Fed news) as they can drive sudden volatility.
---
🔍 Overall Market Context
The price is in a downtrend, clearly shown by the descending channel (highlighted with yellow lines).
The price just broke below the lower boundary of that channel, indicating potential bearish continuation.
The chart includes support/resistance levels, pivot points, and a projected path suggesting possible price behavior.
---
🔧 Key Technical Elements
1. Price Action & Structure
Recent price action shows a strong bearish move (large red candle), suggesting strong selling pressure.
The move bounced off S2, a weekly pivot support level, and entered a demand zone (green area).
2. Projected Scenario (Black Line Path)
A potential pullback to 1.16586 (key resistance).
If price fails to break above that resistance, it's expected to drop again.
Possible next supports:
1.15842
1.15228
Final target: 1.14550
3. Pivot Levels
Weekly Pivot: Near 1.17100 area (currently above the price — bearish implication).
S2 level: Around 1.15900 — presently acting as short-term support.
R1, R2, etc., are above and could act as resistance in a retracement.
---
📊 Summary of Trade Outlook
🔻 Bearish Bias (Short-Term to Medium-Term)
Main idea: This chart reflects a bearish breakout of a descending channel.
Entry Zones: After a potential pullback to resistance (1.16586)
Targets: 1.15842 → 1.15228 → 1.14550
Invalidation: A Bullish break above 1.16586 could invalidate the bearish setup.
---
✅ Trading Considerations
Wait for confirmation of rejection at 1.16129 or 1.16586 before shorting.
Watch for volume confirmation on the pullback.
Monitor fundamentals (e.g. ECB or Fed news) as they can drive sudden volatility.
Disclaimer
The information and publications are not meant to be, and do not constitute, financial, investment, trading, or other types of advice or recommendations supplied or endorsed by TradingView. Read more in the Terms of Use.
Disclaimer
The information and publications are not meant to be, and do not constitute, financial, investment, trading, or other types of advice or recommendations supplied or endorsed by TradingView. Read more in the Terms of Use.