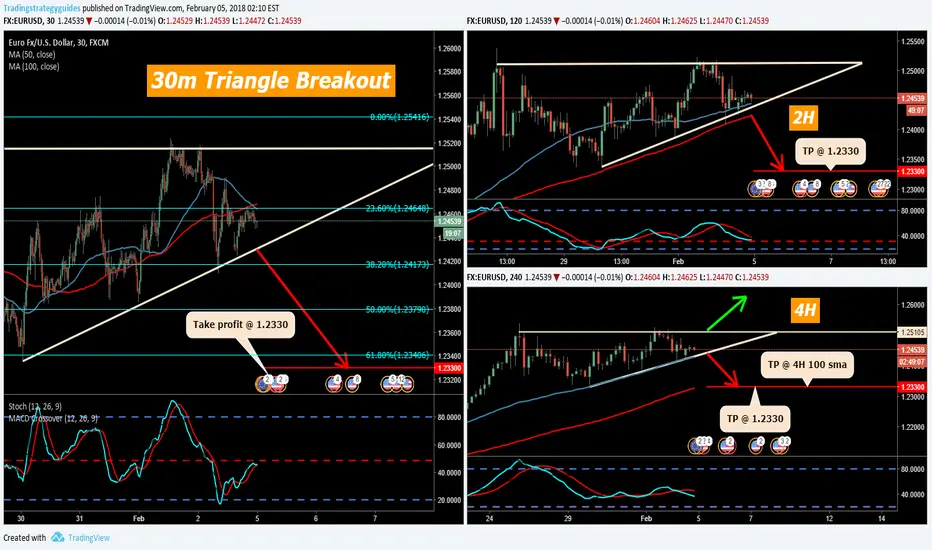
Triangle pattern on 4h - 2h - 30m
Watch for a 30m candle closed below bottom trendline
TP will be 4H 100 sma
Watch for a 30m candle closed below bottom trendline
TP will be 4H 100 sma
Note
TP could be 1.2330 because the 4H 100 sma was at that price when I made the post. But I am going to use the 4H 100 sma where ever it is currently when price hits it. Entry point was when a 30 m candle closes below the lower triangle trendline for a breakout. It has already so if you did not get that entry here is my second entry point. I have a sell stop at 1.2395 which is just below the wicks of the 30 m candles that are below the trendline. Note
On above chart 15m candles had a break -hook - go but the go failed to break the lowest candle of the break section and now the candles are green heading back to the treadline breakout point. This may mean the breakout failed and price may head back into the triangle pattern or price will bounce off bearish the trendline and go short a secon time because market timing wasn't right yet.Note
Here is how I have my charts set up currently - Note
My sell stop has been hit - 15m chartNote
Price hit my original target price of 1.2330 and my revised TP 4H 100 sma @ 1.2342Disclaimer
The information and publications are not meant to be, and do not constitute, financial, investment, trading, or other types of advice or recommendations supplied or endorsed by TradingView. Read more in the Terms of Use.
Disclaimer
The information and publications are not meant to be, and do not constitute, financial, investment, trading, or other types of advice or recommendations supplied or endorsed by TradingView. Read more in the Terms of Use.