• Mixed picture on the weekly EUR/USD chart
• We have bullish and bearish signs
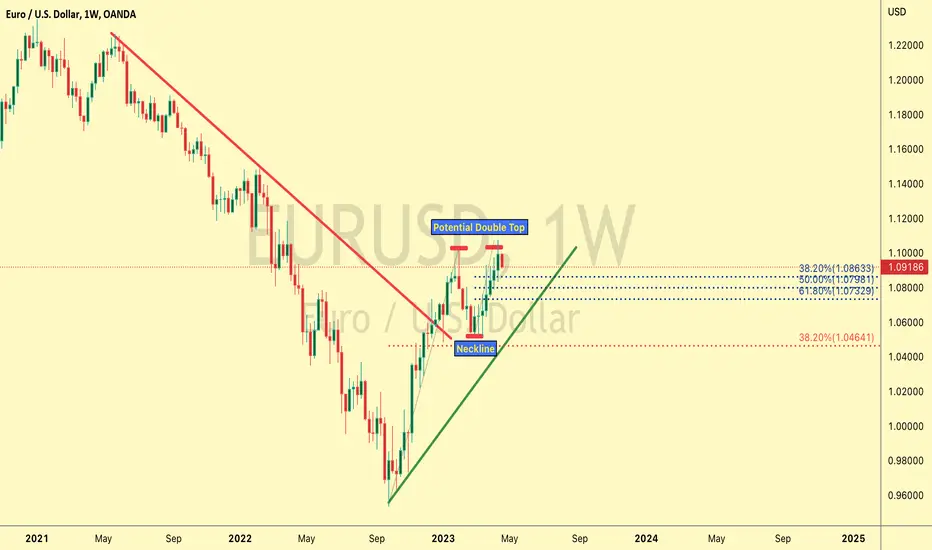
• Bullish signs: Uptrend line still intact despite recent drop
• Still within weekly corrective levels. Prior rally from 0.95 to 1.10 retraced to almost 38.2%
• Descending trend line from May 21 high has been successfully broken in Dec 22
• However, latest leg up from 1.05 to 1.10 didn't experience any correction yet, so last 2 days drops could be potential weekly corrections that might bottom anywhere between 1.0860 and 1.0730 (38.2% and 61.8% respectively)
• On the other side, the bearish signs are: The latest leg up failed to make a new high. Instead, it made a double top and bulls were unable to sustain and confirm the breakout.
• A potential double top pattern may be building, with neckline at around 1.050
• A break of 1.050 with several successful daily closes below it, will turn the odds in favor of the bears and we might see the parity level re-tested again
• We have bullish and bearish signs
• Bullish signs: Uptrend line still intact despite recent drop
• Still within weekly corrective levels. Prior rally from 0.95 to 1.10 retraced to almost 38.2%
• Descending trend line from May 21 high has been successfully broken in Dec 22
• However, latest leg up from 1.05 to 1.10 didn't experience any correction yet, so last 2 days drops could be potential weekly corrections that might bottom anywhere between 1.0860 and 1.0730 (38.2% and 61.8% respectively)
• On the other side, the bearish signs are: The latest leg up failed to make a new high. Instead, it made a double top and bulls were unable to sustain and confirm the breakout.
• A potential double top pattern may be building, with neckline at around 1.050
• A break of 1.050 with several successful daily closes below it, will turn the odds in favor of the bears and we might see the parity level re-tested again
Disclaimer
The information and publications are not meant to be, and do not constitute, financial, investment, trading, or other types of advice or recommendations supplied or endorsed by TradingView. Read more in the Terms of Use.
Disclaimer
The information and publications are not meant to be, and do not constitute, financial, investment, trading, or other types of advice or recommendations supplied or endorsed by TradingView. Read more in the Terms of Use.