showing technical analysis and a projected price path. Here’s a breakdown of what’s visible:
🔍 Chart Overview
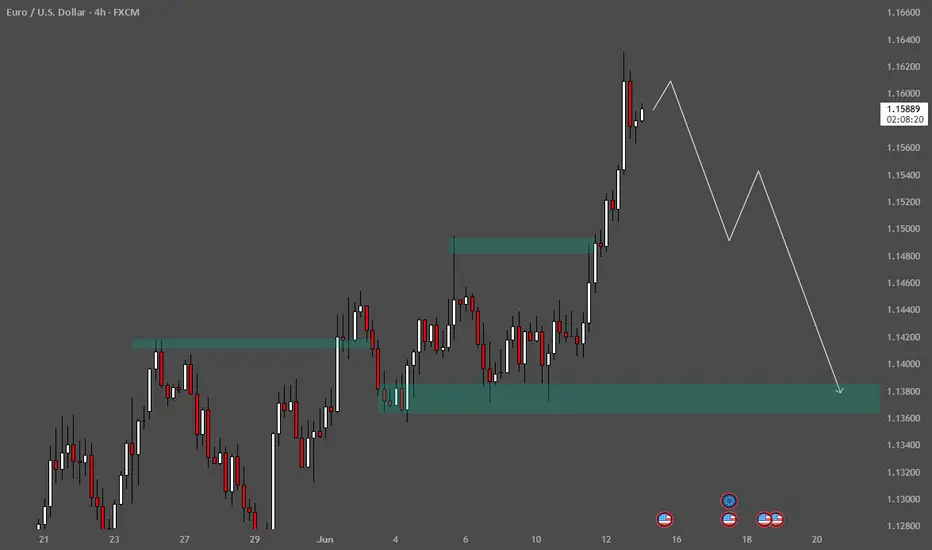
Pair: EUR/USD
Timeframe: 4H (4-hour)
Current Price: ~1.15881
Date/Time: Around June 13, 2025, 3:47 AM (UTC+3)
🟩 Highlighted Zones
Upper Supply Zone (resistance area):
Around 1.15150 – 1.15300
Price previously reacted and broke above this zone.
Lower Demand Zone (support area):
Between 1.13600 – 1.13900
Price bounced from this level in the past.
Intermediate Zone (recent consolidation):
Around 1.14300 – 1.14500
Possibly an area of minor structure or reaccumulation.
📈 Price Action
Price made a strong bullish move, breaking through previous resistance zones.
Bearish pin bar (rejection wick) at the top suggests potential reversal or pullback.
🔮 Projected Price Path (White Lines)
The drawn projection suggests:
Short-term pullback, possibly to retest the 1.15300–1.15150 area.
A minor lower high forms.
Deeper drop expected toward the demand zone at 1.13800 or lower.
🧠 Analysis Implication
This is likely a swing trader’s roadmap, anticipating a reversal after an overextended move.
The analysis could be based on liquidity sweep above highs and return to structure.
🔍 Chart Overview
Pair: EUR/USD
Timeframe: 4H (4-hour)
Current Price: ~1.15881
Date/Time: Around June 13, 2025, 3:47 AM (UTC+3)
🟩 Highlighted Zones
Upper Supply Zone (resistance area):
Around 1.15150 – 1.15300
Price previously reacted and broke above this zone.
Lower Demand Zone (support area):
Between 1.13600 – 1.13900
Price bounced from this level in the past.
Intermediate Zone (recent consolidation):
Around 1.14300 – 1.14500
Possibly an area of minor structure or reaccumulation.
📈 Price Action
Price made a strong bullish move, breaking through previous resistance zones.
Bearish pin bar (rejection wick) at the top suggests potential reversal or pullback.
🔮 Projected Price Path (White Lines)
The drawn projection suggests:
Short-term pullback, possibly to retest the 1.15300–1.15150 area.
A minor lower high forms.
Deeper drop expected toward the demand zone at 1.13800 or lower.
🧠 Analysis Implication
This is likely a swing trader’s roadmap, anticipating a reversal after an overextended move.
The analysis could be based on liquidity sweep above highs and return to structure.
Trade active
1st Target Hit.💰 King Maker FX — Master the Gold Market with Precision.
Unlock real-time trends, pro strategies, and expert insights to turn every move into profit. 🚀✨ t.me/kmforexllc
Unlock real-time trends, pro strategies, and expert insights to turn every move into profit. 🚀✨ t.me/kmforexllc
Disclaimer
The information and publications are not meant to be, and do not constitute, financial, investment, trading, or other types of advice or recommendations supplied or endorsed by TradingView. Read more in the Terms of Use.
💰 King Maker FX — Master the Gold Market with Precision.
Unlock real-time trends, pro strategies, and expert insights to turn every move into profit. 🚀✨ t.me/kmforexllc
Unlock real-time trends, pro strategies, and expert insights to turn every move into profit. 🚀✨ t.me/kmforexllc
Disclaimer
The information and publications are not meant to be, and do not constitute, financial, investment, trading, or other types of advice or recommendations supplied or endorsed by TradingView. Read more in the Terms of Use.