Technical Analysis & Trade Plan for TradingView Idea
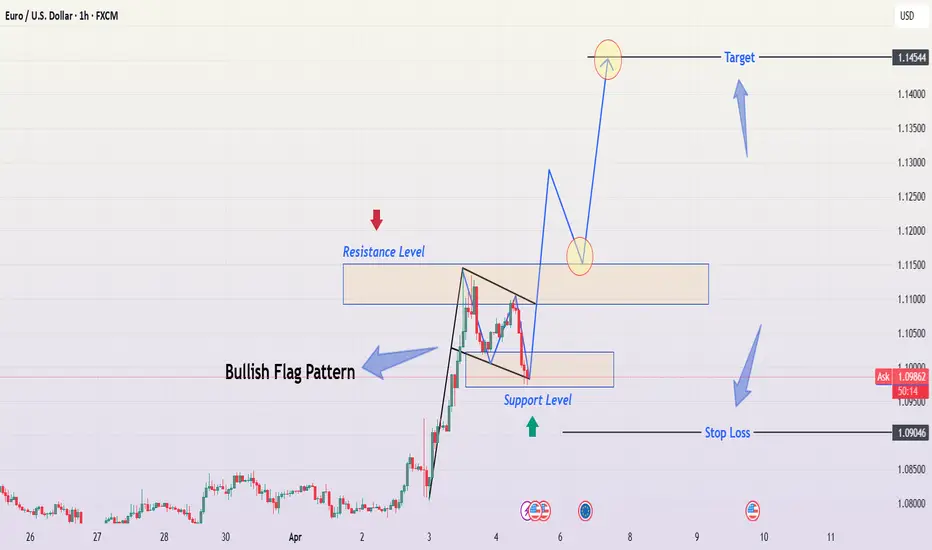
This chart illustrates a Bullish Flag Pattern on the EUR/USD 1-hour timeframe, suggesting a potential continuation of the prevailing uptrend. Below is a detailed breakdown of the market structure, key levels, and a professional trading strategy.
📌 Chart Pattern: Bullish Flag Formation
The Bullish Flag is a continuation pattern that forms after a strong upward price movement, followed by a short period of consolidation within a downward-sloping channel. It signals a brief pause before the trend resumes.
Flagpole: The sharp price increase before the consolidation.
Flag: The corrective downward movement forming a small parallel channel.
Breakout Potential: A confirmed breakout above resistance could lead to a further bullish rally.
🔍 Key Technical Levels & Market Structure
🔵 Resistance Level (Supply Zone)
The upper boundary of the flag pattern acts as resistance.
A breakout above this level could trigger a strong buying opportunity.
🟢 Support Level (Demand Zone)
The lower boundary of the flag provides support.
Price is currently testing this zone, which is a critical decision point.
🎯 Target Price: 1.14544 (Projected Move)
The price target is calculated based on the height of the flagpole added to the breakout point.
This aligns with a previous significant resistance area.
📈 Trading Strategy & Execution Plan
✅ Entry Criteria:
A confirmed breakout above the flag's resistance level with a strong bullish candlestick.
Increased trading volume supporting the breakout.
🚨 Risk Management:
Stop Loss: Placed below the support zone of the flag to manage risk in case of a false breakout.
Take Profit Target: At 1.14544, aligning with the measured move of the flag pattern.
📊 Trade Confirmation Indicators:
RSI (Relative Strength Index): A reading above 50 confirms bullish momentum.
Moving Averages (50 EMA/200 EMA): A bullish crossover would strengthen the buying signal.
Volume Analysis: A breakout should be accompanied by high trading volume for confirmation.
⚠️ Potential Risks & Alternative Scenarios
Fake Breakout: If the price breaks out but lacks volume, it could be a false signal.
Bearish Reversal: If price breaks below the support zone, the bullish flag setup becomes invalid.
Market Sentiment Shift: Unexpected news events can impact price movement.
📝 Summary
The EUR/USD pair has formed a Bullish Flag Pattern, signaling a possible continuation of the uptrend.
A breakout above the resistance level would confirm the pattern and provide a strong buying opportunity.
Risk management is essential, with a stop loss placed below the support level.
Final Target: 1.14544, based on the flagpole’s measured move.
💡 Conclusion: A well-structured breakout above resistance could lead to a bullish rally toward 1.14544. However, patience and confirmation are key before entering the trade.
For Daily Trade Setups and Forecast: 📈 t.me/xauusdoptimizer
Premium Signals Fr33: 💯 t.me/xauusdoptimizer
🥰🥳🤩
Premium Signals Fr33: 💯 t.me/xauusdoptimizer
🥰🥳🤩
Related publications
Disclaimer
The information and publications are not meant to be, and do not constitute, financial, investment, trading, or other types of advice or recommendations supplied or endorsed by TradingView. Read more in the Terms of Use.