TradingView chart for EUR/USD (30-minute )
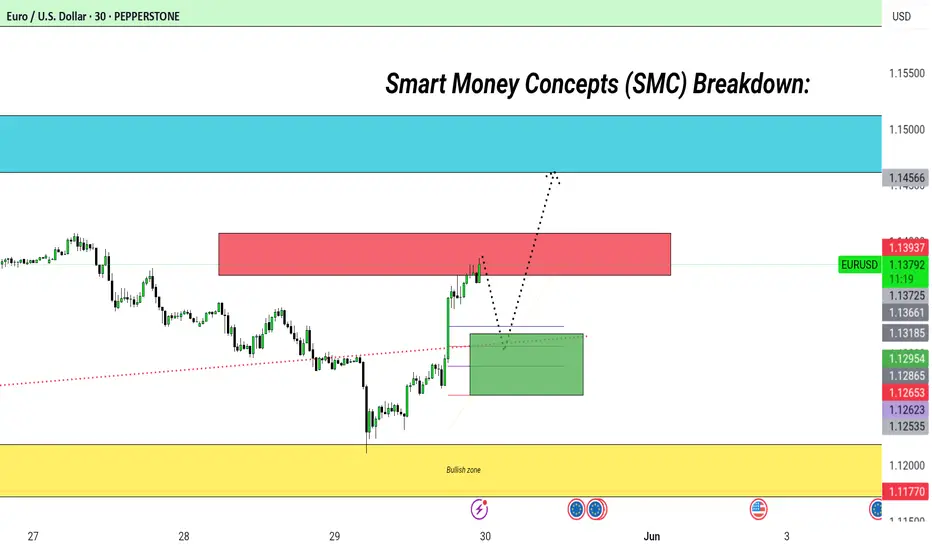
🧠 Smart Money Concepts (SMC) Breakdown:
🟨 Bullish Zone (Demand)
Marked in yellow, this is the strong demand zone where price recently reversed.
This zone aligns with a potential order block or a liquidity grab.
🟩 Green Box (Potential Re-entry Zone)
This is your optimal trade entry (OTE) zone.
Price is expected to retrace to this zone after facing resistance at the red supply zone.
It aligns with the discount level (below 50% of recent move).
🟥 Red Box (Supply Zone / POI)
Price is currently reacting to this zone.
This may be a short-term rejection point leading to the expected retracement.
🟦 Blue Box (Higher-Timeframe POI / Supply)
A major target zone likely acting as liquidity above swing highs.
If price breaks and holds above red zone, this is the next target for longs.
🟩 Light Green Box (Final Target / Weekly Level)
Likely a weekly supply level or final target for a full bullish expansion.
---
📈 Projection (Dashed Arrows):
1. Short-Term Bearish Move: Price dips into green demand zone.
2. Long Entry from Demand: Potential bullish continuation from green zone to break above red.
3. Target Blue Supply: If red is broken, price will head to the blue zone next.
---
Highlight entry point near green box for 1:3+ RR.
Show retracement plan instead of immediate breakout.
Emphasize liquidity hunt at red zone before continuation.
“
---
Would you like me to do analysis of. Other pair , mention in comments,🖇️
Related publications
Disclaimer
The information and publications are not meant to be, and do not constitute, financial, investment, trading, or other types of advice or recommendations supplied or endorsed by TradingView. Read more in the Terms of Use.
Related publications
Disclaimer
The information and publications are not meant to be, and do not constitute, financial, investment, trading, or other types of advice or recommendations supplied or endorsed by TradingView. Read more in the Terms of Use.