📉 How This Trade Could Have Played Out – EURUSD, 15min Chart
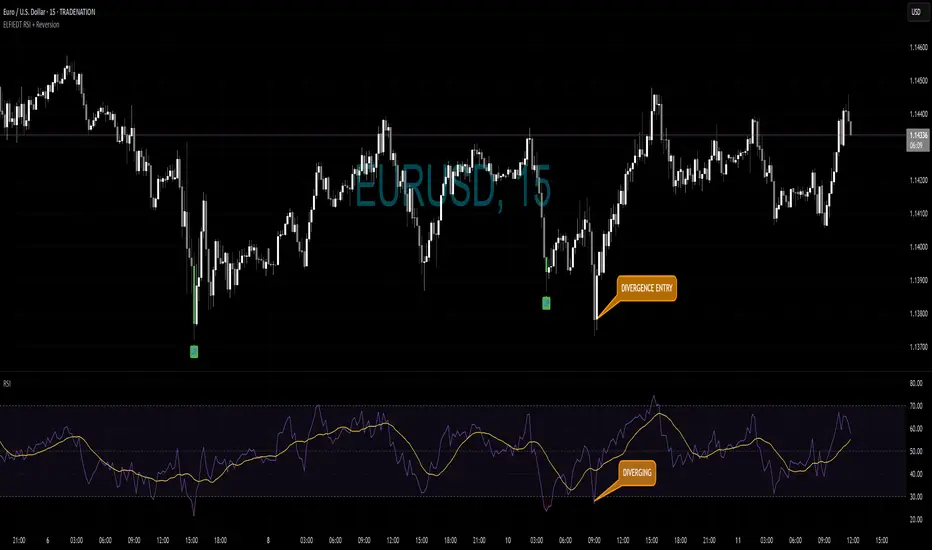
This chart demonstrates a textbook example of how to use the ELFIEDT RSI + 3SD Reversion Strategy with additional RSI divergence to identify a high-probability reversal setup.
🟢 What Happened Here:
✅ Buy Signal Triggered
The script printed a green "UP" signal as price dipped sharply — closing beyond the lower volatility band with momentum in oversold territory and a spike in volume. This marked the initial mean reversion opportunity.
📉 RSI Divergence Formed
Just after the price made a lower low, the RSI formed a higher low — classic bullish divergence, showing underlying strength even as price dropped. This added confluence to the signal.
💡 Divergence-Based Entry Zone
With price recovering above the signal bar and RSI breaking upward, traders could use this divergence as a secondary confirmation entry — improving timing and confidence.
📈 Momentum Followed Through
After the signal and confirmation, price reversed strongly upward with a clear multi-candle move, offering multiple reward opportunities depending on your exit style.
✅ How to Trade It (Step-by-Step)
Wait for a signal label (green/red) from the script — this marks a statistically stretched price condition with volume support.
Add the RSI indicator to your chart.
Watch for divergence (price making a new low, but RSI not confirming) near the signal — this gives you a stronger reason to enter.
Look for a reversal candle (like a bullish engulfing, pin bar, or inside bar) for clean entry timing.
Use the previous low as a stop and target a 1:2 or better reward-risk ratio based on price structure.
🔁 Pro Tip: Top-Down Boost
This exact signal is even more powerful if a similar setup appears on the 1-hour and 5-minute charts around the same area.
✅ When multiple timeframes agree, it’s a higher-probability zone to enter.
🧠 This approach blends statistics, momentum, and price action — giving you structure and flexibility as a trader.
Note
📌 Pinned Comment — Please Read FirstHi everyone 👋
Thanks for checking out the ELFIEDT RSI + Reversion Strategy!
This script is designed to help traders identify potential price exhaustion zones using a blend of statistical volatility, RSI momentum, and volume spikes. Everything shared here — including the trade examples, signal breakdowns, and chart commentary — is intended purely for educational and informational purposes.
🧠 What You Can Expect Here:
Clear examples showing how the script has worked on past price action
Tips on combining signals with candlestick patterns, RSI divergence, or multi-timeframe confluence
Ideas to help you understand how price behaves at extremes — not financial advice or guaranteed trade signals
⚠️ Please remember: This is not financial advice. Always do your own research, manage your risk, and test everything in a way that fits your trading style and experience.
Let me know how you’re using the script or if you'd like to see new features added!
Happy trading!
– ELFIEDT 💚
Join us to get free access to all indicators we created!
Disclaimer
The information and publications are not meant to be, and do not constitute, financial, investment, trading, or other types of advice or recommendations supplied or endorsed by TradingView. Read more in the Terms of Use.
Join us to get free access to all indicators we created!
Disclaimer
The information and publications are not meant to be, and do not constitute, financial, investment, trading, or other types of advice or recommendations supplied or endorsed by TradingView. Read more in the Terms of Use.