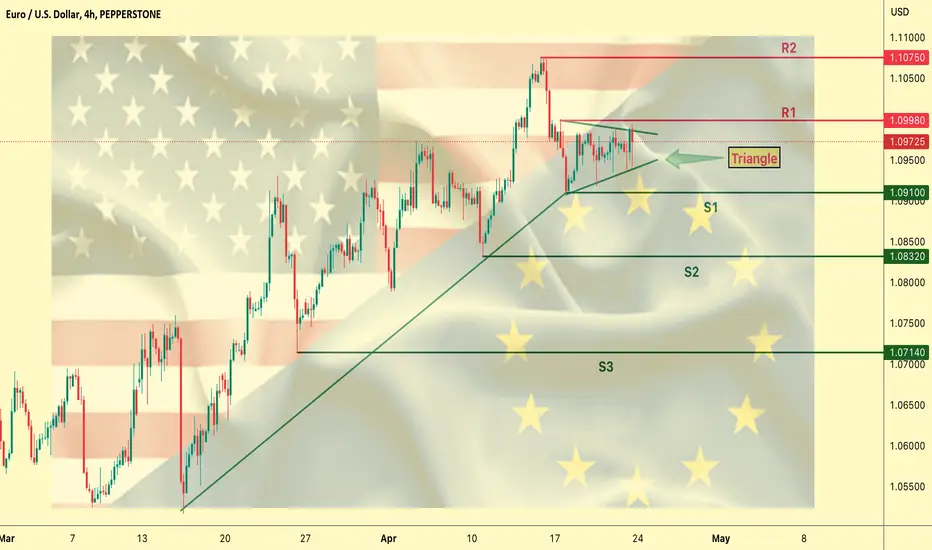
• Triangle pattern on hourly chart, so consolidation mode and sideways market
• Triangle is usually a continuation pattern
• Previous move was bullish, so breakout should be to the upside
• First support 1.0910 followed by 1.08320 and 1.07140
• First resistance 1.09980 followed by yearly highs at 1.10750
• Triangle breakout target as per the measurement method is a 100 pip move
Note
Breakout to the upside at 1.0980, targeting yearly highs at 1.10750 and 1.11 psychological levelDisclaimer
The information and publications are not meant to be, and do not constitute, financial, investment, trading, or other types of advice or recommendations supplied or endorsed by TradingView. Read more in the Terms of Use.
Disclaimer
The information and publications are not meant to be, and do not constitute, financial, investment, trading, or other types of advice or recommendations supplied or endorsed by TradingView. Read more in the Terms of Use.