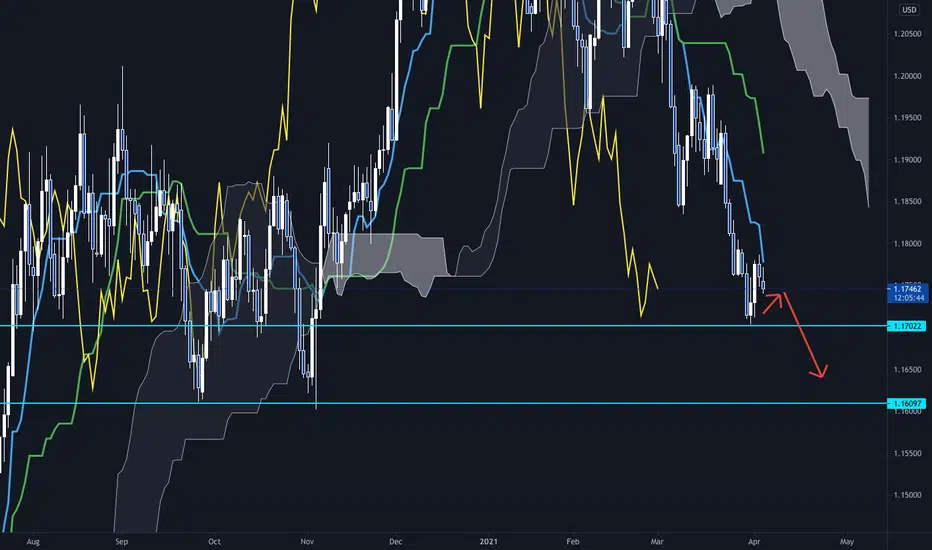
EURUSD Daily chart shows a continuous bearish trend as per below Ichimoku confirmations.
- Kumo (Senko span A) down
- Kijun sen down
- Tenkan sen down
- Chiko Span below candles
If market breaks 1.1702 level, then it can go down to previous support level of 1.1609.
- Kumo (Senko span A) down
- Kijun sen down
- Tenkan sen down
- Chiko Span below candles
If market breaks 1.1702 level, then it can go down to previous support level of 1.1609.
Note
Please watch below video for further explanation.youtu.be/ntKZsH80Jak
Forex Kei
Official Website: forex-kei.com
Global Trading School: forex-kei.com/?page_id=2855
KTS Academy: keistradingstrategy.com
Official Website: forex-kei.com
Global Trading School: forex-kei.com/?page_id=2855
KTS Academy: keistradingstrategy.com
Related publications
Disclaimer
The information and publications are not meant to be, and do not constitute, financial, investment, trading, or other types of advice or recommendations supplied or endorsed by TradingView. Read more in the Terms of Use.