Smart Money Concepts (SMC) principles. Here’s a full breakdown of the chart and its annotations:
📊
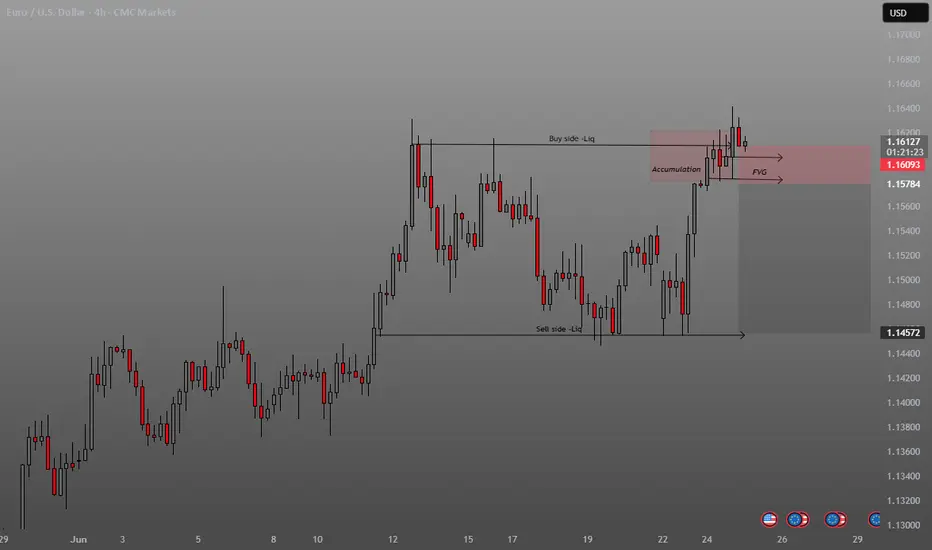
Chart Details:
Pair: EUR/USD
Timeframe: 4-hour (H4)
Current Price: Around 1.16093 USD
🔍
Key Annotations & Zones:
🟫
Pink Zone (Supply/Resistance Area):
This area includes:
Accumulation
FVG (Fair Value Gap)
Price has recently entered and reacted from this zone.
🔼
Buy Side Liquidity:
Highlighted at the top of the range.
Price swept above recent highs to trigger buy stops (liquidity grab), possibly setting up for a reversal.
🔽
Sell Side Liquidity:
Marked below the previous consolidation range.
Price had previously dipped to collect sell-side liquidity before moving upward.
📈
Accumulation:
This phase occurred before the bullish breakout.
Suggests institutional buying or smart money positioning.
📉
FVG (Fair Value Gap):
Imbalance between buying and selling, typically gets filled.
Marked in the pink zone where price may return before continuing its move.
📌
Price Structure Analysis:
The chart shows a classic liquidity sweep setup:
Price grabs buy-side liquidity.
Enters a supply zone.
May return to fill the FVG.
Potential reversal or bearish reaction from this zone.
✅
Trading Implications:
Bearish Scenario:
Price may reject from the pink supply zone after the buy-side liquidity sweep, filling the FVG and possibly heading toward previous lows.
Bullish Scenario (less likely immediately):
If price holds above the pink zone, it could continue trending upward.
📊
Chart Details:
Pair: EUR/USD
Timeframe: 4-hour (H4)
Current Price: Around 1.16093 USD
🔍
Key Annotations & Zones:
🟫
Pink Zone (Supply/Resistance Area):
This area includes:
Accumulation
FVG (Fair Value Gap)
Price has recently entered and reacted from this zone.
🔼
Buy Side Liquidity:
Highlighted at the top of the range.
Price swept above recent highs to trigger buy stops (liquidity grab), possibly setting up for a reversal.
🔽
Sell Side Liquidity:
Marked below the previous consolidation range.
Price had previously dipped to collect sell-side liquidity before moving upward.
📈
Accumulation:
This phase occurred before the bullish breakout.
Suggests institutional buying or smart money positioning.
📉
FVG (Fair Value Gap):
Imbalance between buying and selling, typically gets filled.
Marked in the pink zone where price may return before continuing its move.
📌
Price Structure Analysis:
The chart shows a classic liquidity sweep setup:
Price grabs buy-side liquidity.
Enters a supply zone.
May return to fill the FVG.
Potential reversal or bearish reaction from this zone.
✅
Trading Implications:
Bearish Scenario:
Price may reject from the pink supply zone after the buy-side liquidity sweep, filling the FVG and possibly heading toward previous lows.
Bullish Scenario (less likely immediately):
If price holds above the pink zone, it could continue trending upward.
Disclaimer
The information and publications are not meant to be, and do not constitute, financial, investment, trading, or other types of advice or recommendations supplied or endorsed by TradingView. Read more in the Terms of Use.
Disclaimer
The information and publications are not meant to be, and do not constitute, financial, investment, trading, or other types of advice or recommendations supplied or endorsed by TradingView. Read more in the Terms of Use.