🔍 Disruptive Counter-Analysis
1. False Breakout Risk
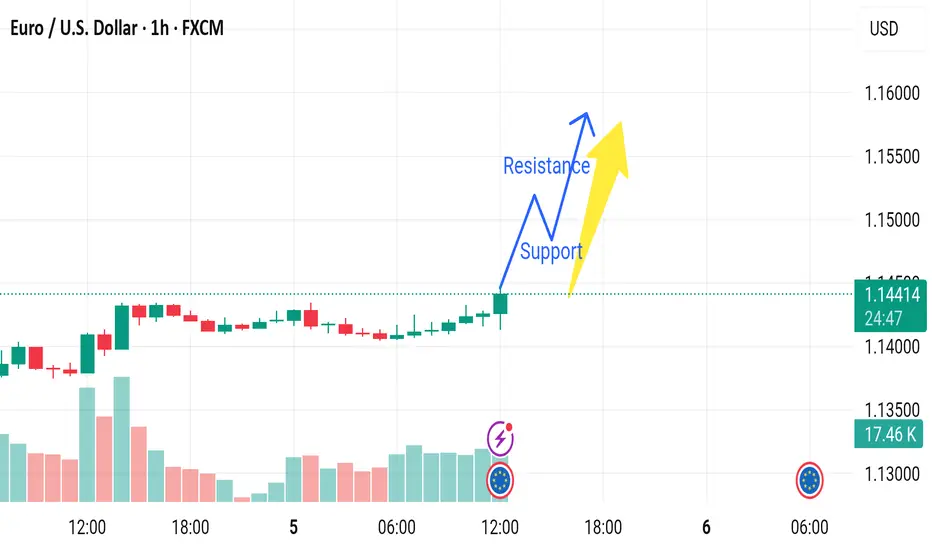
The current breakout could be a bull trap. Price may break above the resistance level temporarily before reversing sharply.
Volume Analysis: The volume isn't significantly higher at the breakout candle, which may suggest a lack of strong momentum or institutional participation.
2. Resistance Zone Ahead
The 1.14500 to 1.15000 range is historically a supply zone, where sellers may aggressively enter the market.
This makes any upside move vulnerable to a reversal near that zone.
3. Macroeconomic Risk
A red-circled economic event icon appears on the chart (likely an ECB or Fed-related release). This adds uncertainty—news can invalidate technical patterns.
If the event is bearish for the euro (e.g., weak data or dovish ECB comments), the pair could reverse sharply.
4. Overbought Short-Term
A series of green candles without significant pullback suggests short-term overbought conditions.
RSI or other momentum indicators (not shown here) may confirm this. A correction to the previous base is possible.
1. False Breakout Risk
The current breakout could be a bull trap. Price may break above the resistance level temporarily before reversing sharply.
Volume Analysis: The volume isn't significantly higher at the breakout candle, which may suggest a lack of strong momentum or institutional participation.
2. Resistance Zone Ahead
The 1.14500 to 1.15000 range is historically a supply zone, where sellers may aggressively enter the market.
This makes any upside move vulnerable to a reversal near that zone.
3. Macroeconomic Risk
A red-circled economic event icon appears on the chart (likely an ECB or Fed-related release). This adds uncertainty—news can invalidate technical patterns.
If the event is bearish for the euro (e.g., weak data or dovish ECB comments), the pair could reverse sharply.
4. Overbought Short-Term
A series of green candles without significant pullback suggests short-term overbought conditions.
RSI or other momentum indicators (not shown here) may confirm this. A correction to the previous base is possible.
t.me/gold_free_signals1
𝙁𝙤𝙧𝙚𝙭 𝙩𝙧𝙖𝙙𝙞𝙣𝙜 𝙚𝙭𝙥𝙚𝙧𝙞𝙚𝙣𝙘𝙚 𝙩𝙚𝙖𝙢 ☺️ 𝙢𝙖𝙣𝙖𝙜𝙚 𝙮𝙤𝙪𝙧 𝙖𝙘𝙘𝙤𝙪𝙣𝙩 𝙢𝙖𝙠𝙞𝙣𝙜 𝙢𝙤𝙣𝙚𝙮 🤑💰
t.me/gold_free_signals1
𝙁𝙤𝙧𝙚𝙭 𝙩𝙧𝙖𝙙𝙞𝙣𝙜 𝙚𝙭𝙥𝙚𝙧𝙞𝙚𝙣𝙘𝙚 𝙩𝙚𝙖𝙢 ☺️ 𝙢𝙖𝙣𝙖𝙜𝙚 𝙮𝙤𝙪𝙧 𝙖𝙘𝙘𝙤𝙪𝙣𝙩 𝙢𝙖𝙠𝙞𝙣𝙜 𝙢𝙤𝙣𝙚𝙮 🤑💰
t.me/gold_free_signals1
Disclaimer
The information and publications are not meant to be, and do not constitute, financial, investment, trading, or other types of advice or recommendations supplied or endorsed by TradingView. Read more in the Terms of Use.
t.me/gold_free_signals1
𝙁𝙤𝙧𝙚𝙭 𝙩𝙧𝙖𝙙𝙞𝙣𝙜 𝙚𝙭𝙥𝙚𝙧𝙞𝙚𝙣𝙘𝙚 𝙩𝙚𝙖𝙢 ☺️ 𝙢𝙖𝙣𝙖𝙜𝙚 𝙮𝙤𝙪𝙧 𝙖𝙘𝙘𝙤𝙪𝙣𝙩 𝙢𝙖𝙠𝙞𝙣𝙜 𝙢𝙤𝙣𝙚𝙮 🤑💰
t.me/gold_free_signals1
𝙁𝙤𝙧𝙚𝙭 𝙩𝙧𝙖𝙙𝙞𝙣𝙜 𝙚𝙭𝙥𝙚𝙧𝙞𝙚𝙣𝙘𝙚 𝙩𝙚𝙖𝙢 ☺️ 𝙢𝙖𝙣𝙖𝙜𝙚 𝙮𝙤𝙪𝙧 𝙖𝙘𝙘𝙤𝙪𝙣𝙩 𝙢𝙖𝙠𝙞𝙣𝙜 𝙢𝙤𝙣𝙚𝙮 🤑💰
t.me/gold_free_signals1
Disclaimer
The information and publications are not meant to be, and do not constitute, financial, investment, trading, or other types of advice or recommendations supplied or endorsed by TradingView. Read more in the Terms of Use.