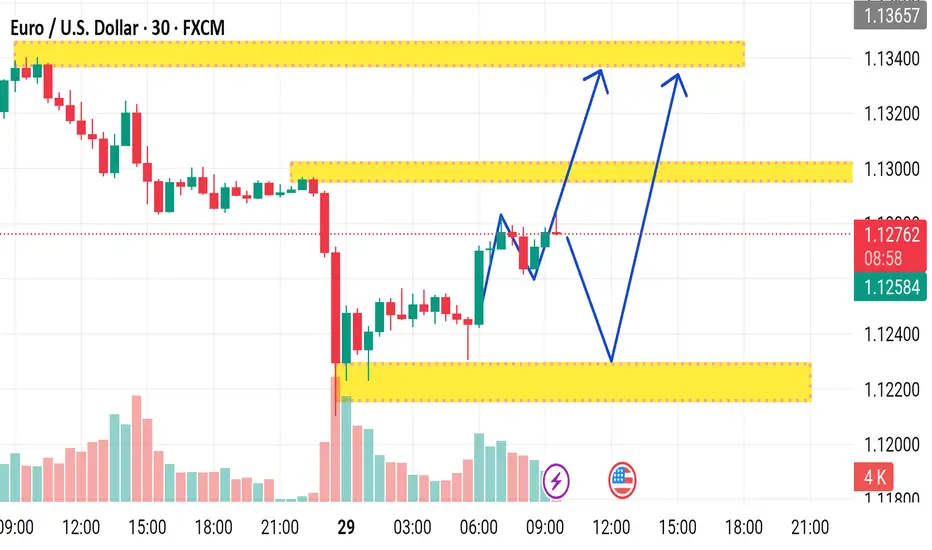
The chart you've shared is a 30-minute candlestick chart for the Euro/US Dollar (EUR/USD) currency pair, published on TradingView. Here’s a breakdown of the technical elements:
Key Levels and Zones:
Support Zone (lower yellow zone): ~1.12100 to ~1.12500
Current Price: 1.12776
Resistance Zones:
Mid resistance zone: ~1.12850 to ~1.13000
Upper resistance zone: ~1.13500 to ~1.13700
Observations:
The price is currently around 1.12776, just below the mid resistance zone.
The chart includes two blue arrow projections:
1. A bullish projection: Suggests a break above the mid resistance, heading toward the upper resistance (~1.13657).
2. A bearish projection: Indicates a potential drop toward the support zone before bouncing back up toward the upper resistance.
Volume:
Noticeable spike in volume during the drop before price stabilized near the support zone, suggesting strong selling pressure was absorbed.
Implications:
If the price breaks above the 1.13000 level with strong volume, it could signal a move toward the 1.13657 level.
A rejection from the mid resistance zone could lead to a retest of the lower support area before attempting another upward move.
Would you like a deeper technical analysis, or help planning trade entries/exits based on this chart?
Disclaimer
The information and publications are not meant to be, and do not constitute, financial, investment, trading, or other types of advice or recommendations supplied or endorsed by TradingView. Read more in the Terms of Use.
Disclaimer
The information and publications are not meant to be, and do not constitute, financial, investment, trading, or other types of advice or recommendations supplied or endorsed by TradingView. Read more in the Terms of Use.