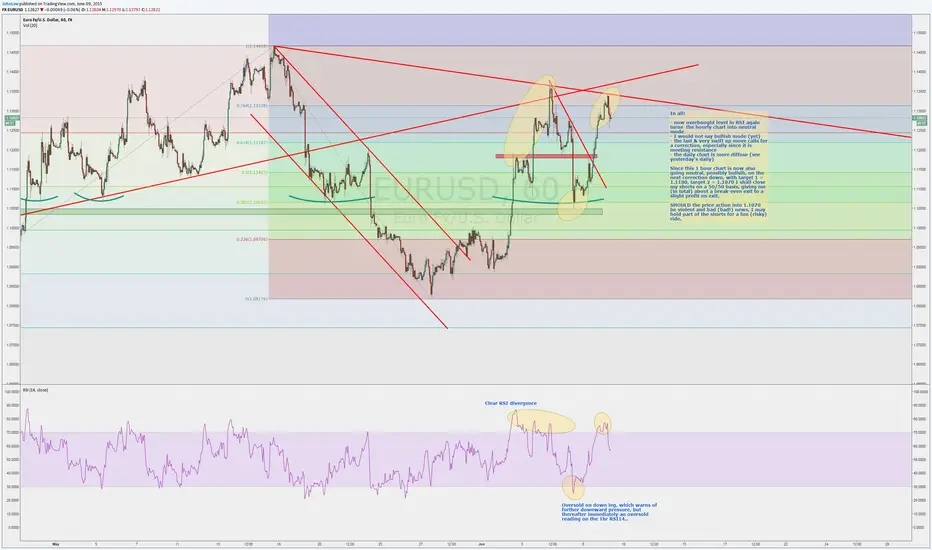
Things have changed on the hourly chart.
- now overbought level in RSI again turns the hourly chart into neutral mode
- I would not say bullish mode (yet)
- the last & very swift up move calls for a correction, especially since it is meeting resistance
- the daily chart is more diffuse (see yesterday's daily)
Since this 1 hour chart is now also going neutral, possibly bullsih, on the next correction down, with target 1 = 1.1180, target 2 = 1.1070 I shall close my shorts on a 50/50 basis, giving me (in total) about a break-even exit to a slight profit on exit.
SHOULD the price action into 1.1070 be violent and bad (bad!) news, I may hold part of the shorts for a fun (risky) ride.
Disclaimer
The information and publications are not meant to be, and do not constitute, financial, investment, trading, or other types of advice or recommendations supplied or endorsed by TradingView. Read more in the Terms of Use.
Disclaimer
The information and publications are not meant to be, and do not constitute, financial, investment, trading, or other types of advice or recommendations supplied or endorsed by TradingView. Read more in the Terms of Use.
