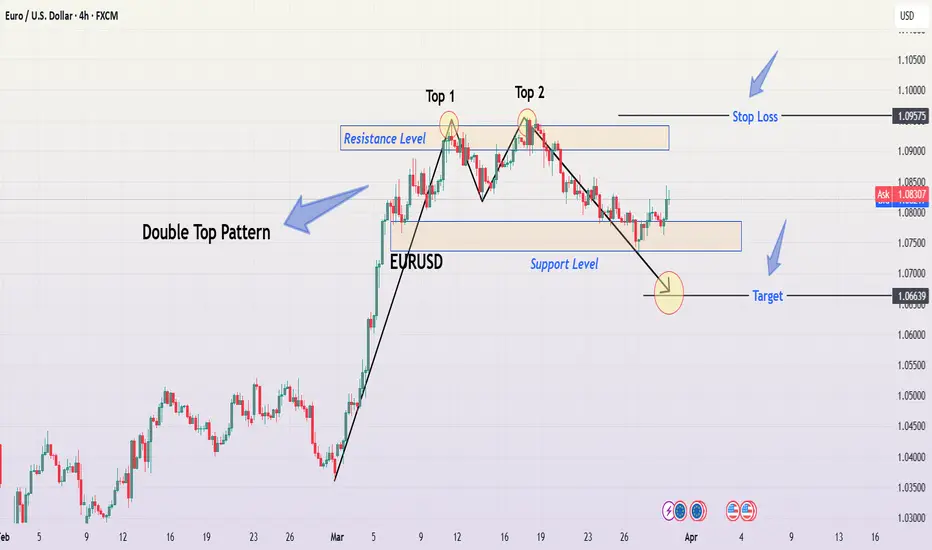
This analysis highlights a Double Top pattern forming on the EUR/USD 4-hour timeframe, which is a classic bearish reversal pattern. The pattern signals a potential shift from a bullish trend to a downtrend, providing traders with a well-defined entry, stop loss, and target levels.
1. Understanding the Double Top Pattern
A Double Top is a trend reversal pattern that forms after an extended uptrend. It consists of two peaks (Top 1 and Top 2) at approximately the same resistance level, followed by a break below the neckline (support level), confirming the pattern.
Pattern Breakdown:
Top 1 & Top 2: These peaks represent failed attempts to break higher, showing strong selling pressure at resistance.
Support (Neckline): The price found support at a key level, where buyers initially stepped in, but eventually, this level was broken, triggering a potential downtrend.
2. Key Levels & Trading Setup
📌 Resistance Level (Bearish Rejection Zone)
The resistance level is marked in the 1.09500 - 1.09600 range.
Price action tested this zone twice (Top 1 & Top 2) but failed to sustain above it.
The repeated rejection indicates that sellers are dominant in this zone.
📌 Support Level (Neckline Breakout Confirmation)
The support level is marked in the 1.07700 - 1.07800 zone.
The price bounced off this area initially, but later broke below it, confirming a bearish move.
The breakout suggests selling momentum is increasing.
3. Trading Strategy – Bearish Setup
🔴 Entry Point (Sell Trigger)
A short trade is confirmed when the price breaks below the neckline (support level) after forming the Double Top.
The breakout confirms seller dominance and signals potential downside movement.
🚨 Stop Loss Placement
Stop Loss is placed slightly above the resistance level at 1.09575.
This ensures protection against false breakouts or price retracements.
🎯 Target (Take Profit Projection)
The price target is calculated based on the height of the Double Top pattern.
Target Level: 1.06639, aligning with the measured move from the resistance to the neckline.
4. Market Outlook & Risk Management
📉 Bearish Scenario (High Probability Move)
✔️ The market structure shows a strong bearish reversal with price failing to break above resistance.
✔️ The confirmed neckline break indicates sellers have taken control.
✔️ If the price continues lower, we can expect a move toward 1.06639.
📈 Bullish Scenario (Invalidation of Trade)
❌ If price closes back above resistance (1.09575), it would invalidate the bearish setup.
❌ This would indicate that buyers are regaining control, and the trade setup should be re-evaluated.
5. Final Thoughts & TradingView Tags
Summary of Trading Setup:
✅ Pattern: Double Top (Bearish Reversal)
✅ Sell Entry: Below the support neckline
✅ Stop Loss: Above 1.09575
✅ Target: 1.06639
✅ Risk-Reward Ratio: Favorable
📌 Tags for TradingView Idea:
#EURUSD #DoubleTop #ForexTrading #BearishReversal #SupportResistance #PriceAction #TechnicalAnalysis #ForexSetup #TradingStrategy
Related publications
Disclaimer
The information and publications are not meant to be, and do not constitute, financial, investment, trading, or other types of advice or recommendations supplied or endorsed by TradingView. Read more in the Terms of Use.
Related publications
Disclaimer
The information and publications are not meant to be, and do not constitute, financial, investment, trading, or other types of advice or recommendations supplied or endorsed by TradingView. Read more in the Terms of Use.