I can see a possible ABC on the daily chart.
Within the C down can we see a complete elliott wave down?
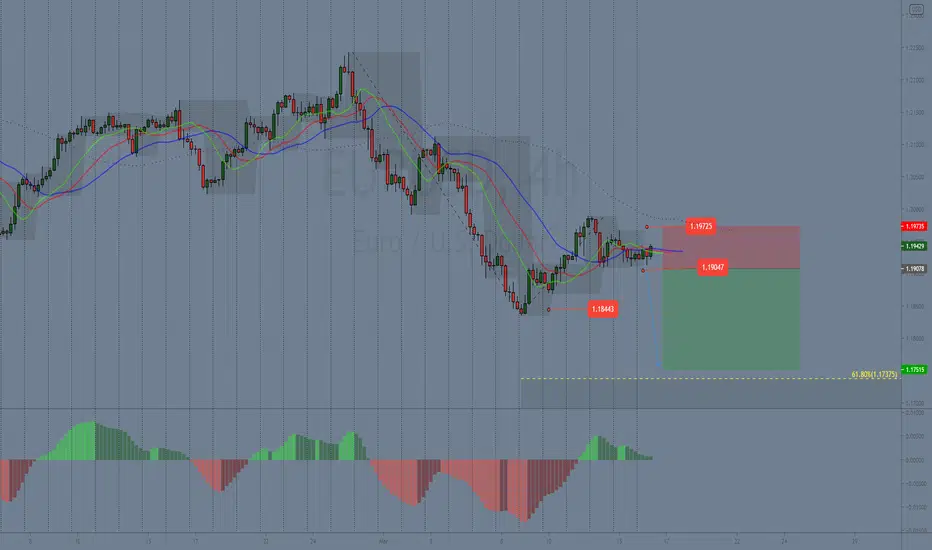
If yes, I'd like to trade the Wave 5 down
I call this The Setup 1.
Entry Level: 1.1905
Stop Loss Level: 1.1975
Target 1 is the bottom of wave 3 around 1.1844
Target 2 is the fib 62% @ 1.1737
negatives: Wave C down might be complete.
Within the C down can we see a complete elliott wave down?
If yes, I'd like to trade the Wave 5 down
I call this The Setup 1.
Entry Level: 1.1905
Stop Loss Level: 1.1975
Target 1 is the bottom of wave 3 around 1.1844
Target 2 is the fib 62% @ 1.1737
negatives: Wave C down might be complete.
To get our premium tools visit: itradeaims.net
Related publications
Disclaimer
The information and publications are not meant to be, and do not constitute, financial, investment, trading, or other types of advice or recommendations supplied or endorsed by TradingView. Read more in the Terms of Use.
To get our premium tools visit: itradeaims.net
Related publications
Disclaimer
The information and publications are not meant to be, and do not constitute, financial, investment, trading, or other types of advice or recommendations supplied or endorsed by TradingView. Read more in the Terms of Use.