🟢 Current Context
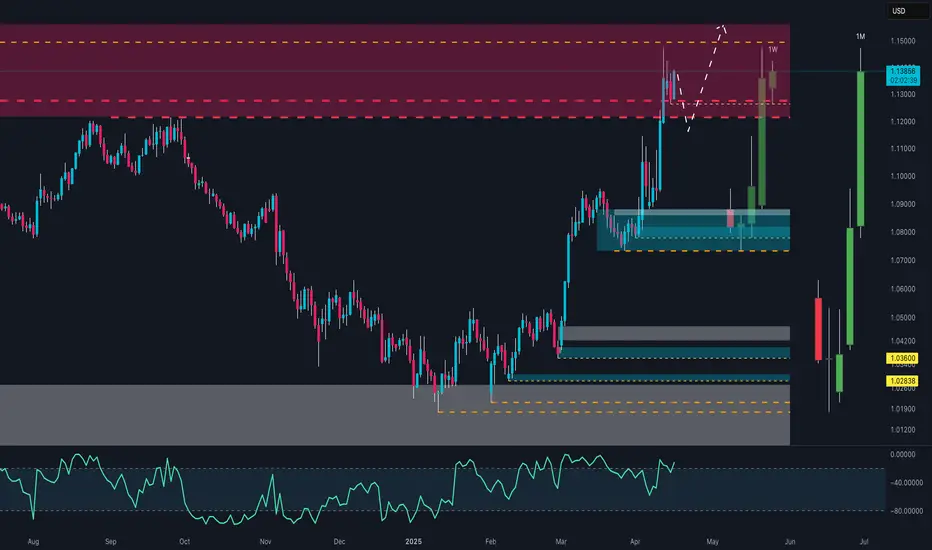
Price: 1.13820 USD
Trend: Strong bullish structure, with impulsive moves especially in April.
Main timeframe: Appears to be daily or weekly, with multi-timeframe zones (1W, 1M marked).
🧱 Key Zones
🔴 Supply Zone (1.13000–1.15000)
Well-defined area of historic selling pressure. Price reacted with a temporary drop but bounced right back into it.
🟦 Demand Zone (1.08500–1.10000)
Major order block where the current rally was initiated. Price used this as a base to launch higher.
⚫ Lower Supports
1.03600: Weekly support
1.02838: Monthly support
Broad accumulation zone (grey box) from which this trend began.
📈 Price Structure
Strong breakout above 1.10–1.11 resistance.
Currently pulling back inside the supply zone – the dashed arrows hint at potential liquidity sweeps before a continuation to 1.15+.
🔍 Momentum Indicator (likely RSI/CCI)
Currently elevated, but not yet in extreme overbought. No clear divergence. Momentum favors bulls.
📊 Scenarios
✅ Bullish:
Clean break above 1.14500–1.15000 opens the door to 1.1600 and 1.1800. Wait for a structural retest for safer long entries.
⚠️ Bearish (corrective):
Strong rejection from the supply zone → potential pullback to 1.10–1.0850 (blue zone).
Only below 1.0850 would a deeper bearish structure toward 1.03600 be confirmed.
🧠 Strategic Note
This is a zone of clear smart money activity: liquidity grabs on both ends.
Watch how this weekly candle closes – we’re either validating above 1.13 or setting up a trap for late longs.
📈 Nicola | EdgeTradingJourney
Documenting my path to $1M in prop capital through real trading, discipline, and analysis.
Documenting my path to $1M in prop capital through real trading, discipline, and analysis.
Disclaimer
The information and publications are not meant to be, and do not constitute, financial, investment, trading, or other types of advice or recommendations supplied or endorsed by TradingView. Read more in the Terms of Use.