🔍 Structure Analysis:
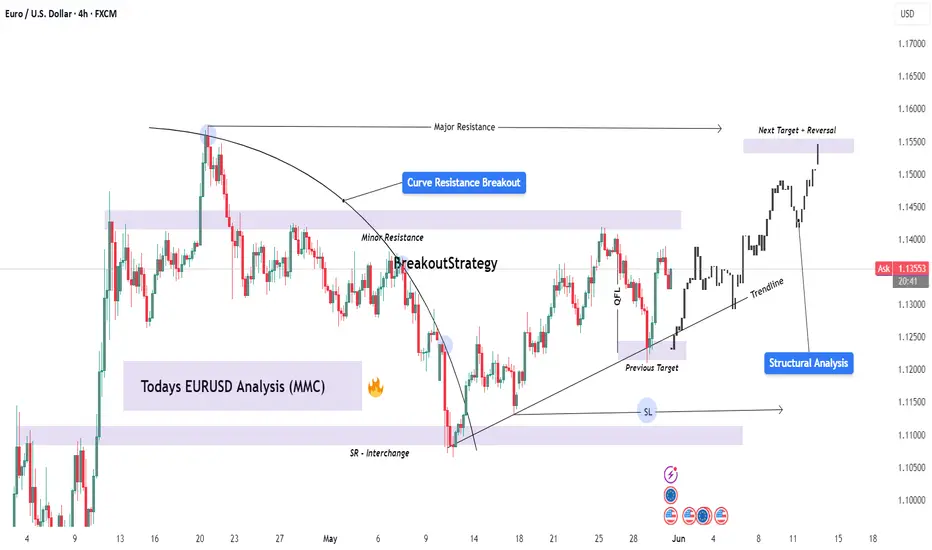
The EURUSD pair has been exhibiting classic smart money behavior following a reaccumulation phase beneath a curved resistance structure. This curve acted as a dynamic liquidity ceiling, engineered to trap breakout traders during early sessions and encourage early shorts — only to be invalidated later by institutional momentum.
What we now see is a clean structural breakout, a shift in market sentiment, and a precision drive toward premium liquidity zones, where we expect reactions from institutional orders or profit-taking.
📐 Technical Breakdown:
🔹 1. Curved Resistance Breakout (Trend Manipulation Layer)
The curve represents a multi-touch descending resistance line that was gradually compressing price.
Multiple rejections created a false sense of bearish continuation, but in reality, smart money was accumulating positions under the curve.
The final breakout was impulsive and occurred on elevated volume, breaking both the curve and a short-term bearish structure.
🔹 2. Bullish Market Structure Confirmation
Higher highs and higher lows are now clearly established.
After the curve break, the price pulled back slightly, respecting the new trendline support — a sign of retest behavior and continuation.
The previous internal structure break was confirmed after a key swing high was violated, flipping the order flow to bullish.
🔹 3. SR Interchange + QFL Demand Zone
The 1.11800–1.12200 zone held firm during the retracement, previously acting as a strong resistance and now a support flip.
This zone coincides with a QFL-style accumulation base — a concept based on sudden dips into support where big orders are filled before sharp reversals.
Wick rejections and candle closes show strong interest by buyers.
🔹 4. Trendline & Structure Alignment
A clean ascending trendline is acting as dynamic support.
Each touch on the trendline has been followed by bullish expansion — another indication of institutional order flow support.
This trendline also aligns with internal FVGs (Fair Value Gaps), offering more confluence.
🔹 5. Liquidity Magnet: Next Major Zone
The next key area is marked around 1.15500–1.15750, which is a previous structural high, order block, and likely liquidity pool for pending sell-side orders.
This area is expected to act as a magnet, pulling price toward it before a potential reversal or redistribution phase begins.
📊 Trade Management Plan:
Parameter Details
Bias Bullish (Short-Term to Mid-Term)
Entry Zones Retest of trendline or minor FVGs
TP1 1.14500 (interim supply)
TP2 (Main) 1.15500–1.15750 (major liquidity zone)
SL Below 1.11800 (invalidates bullish idea)
RR Target 1:2.5 to 1:3 depending on entry precision
🧠 Concepts Applied:
Smart Money Concepts (SMC)
Break of Structure (BOS) & Change of Character (CHOCH)
Curve Manipulation / Compression
SR Flip (Support-Resistance Interchange)
QFL (Quasimodo Failure Level)
Trendline + FVG Confluence
Liquidity Pool Targeting
Volume Expansion Breakout Confirmation
🛎️ Watchlist Notes & Trade Expectations:
Expect short-term pullbacks into the 1.13000–1.13200 zone for liquidity re-tests.
Watch for reaction or sweep near 1.15500 — this is where short-term sellers may enter, and institutions may offload.
If price holds above the trendline and consolidates near the high, a continuation leg to even higher targets (1.16500) is possible — depending on macro conditions.
✅ Conclusion:
This EURUSD setup is a high-probability opportunity shaped by smart money behavior and deep structural context. The combination of the curve breakout, trendline strength, and liquidity targeting provides a clear roadmap for execution and management.
Use this analysis as a framework — always confirm with price action and risk management aligned with your personal strategy.
For Daily Trade Setups and Forecast: 📈 t.me/xauusdoptimizer
Premium Signals Fr33: 💯 t.me/xauusdoptimizer
🥰🥳🤩
Premium Signals Fr33: 💯 t.me/xauusdoptimizer
🥰🥳🤩
Related publications
Disclaimer
The information and publications are not meant to be, and do not constitute, financial, investment, trading, or other types of advice or recommendations supplied or endorsed by TradingView. Read more in the Terms of Use.