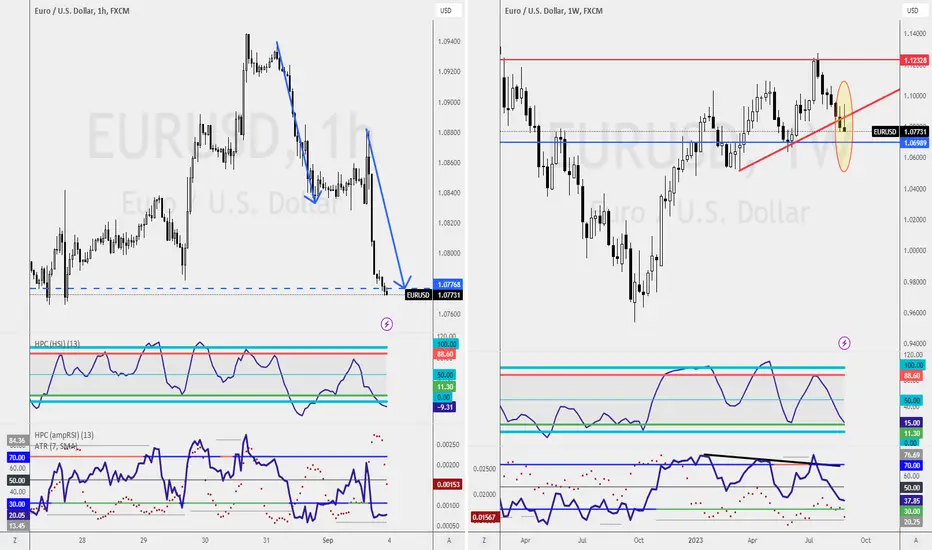
📊 Weekly Chart: Overall bullish, but watch current candle.
📈 Daily Chart: Bearish movement, key level 1.0766.
🕓 Four Hour Chart: Sensitive period, focus on 1.0766.
⏳ One Hour Chart: Multi-timeframe analysis.
🔍 Higher Timeframes: Confirm breaks below key levels.
🚀 Aggressive Short Opportunity:
Wait for trend line retest.
Look for break below 1.0705 or 1.0651.
📉 Weekly Chart Analysis:
Trend line broken.
Set alerts for retest.
Consider aggressive shorting.
📊 Daily Chart:
Wait for retest for aggressive short.
Potential 130 pips opportunity.
🦈 Four Hour Chart:
Shark pattern may be invalid.
Customize chart for accuracy.
📈 One Hour Chart:
AB=CD movement.
Wait for 3-bar reversal for buying.
Double bottom with RSI divergence.
🕒 15mins workday for Young Parents
🏦 Qualify Junior Analyst within 90days
🎤 Keynote Speaker
Get into our 15mins workday community
discord.gg/AKDr9vPqH7
Live session & Trading Tips on the GO
instagram.com/raynlim/
🏦 Qualify Junior Analyst within 90days
🎤 Keynote Speaker
Get into our 15mins workday community
discord.gg/AKDr9vPqH7
Live session & Trading Tips on the GO
instagram.com/raynlim/
Disclaimer
The information and publications are not meant to be, and do not constitute, financial, investment, trading, or other types of advice or recommendations supplied or endorsed by TradingView. Read more in the Terms of Use.