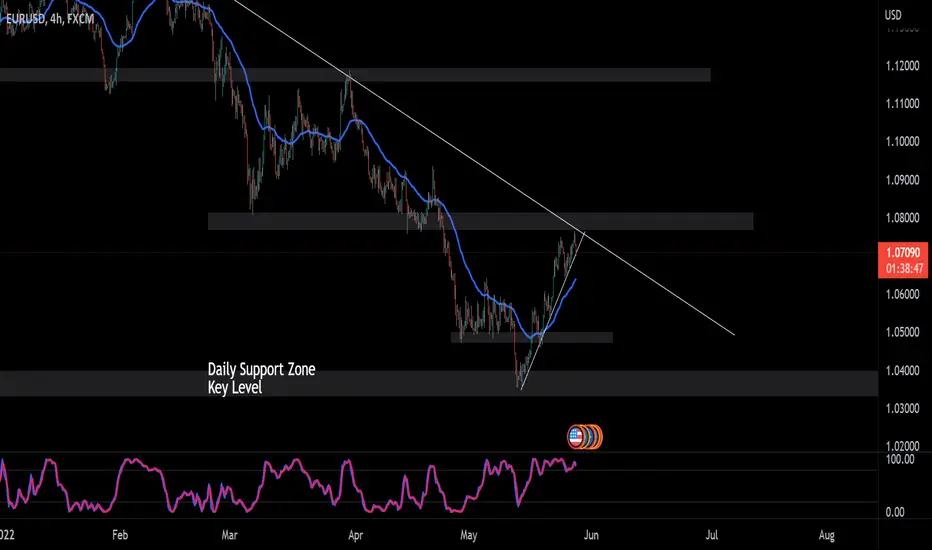
Strickly based off of technical analysis here.
Price did hit and touch the daily support zone for a double bottom.
Price came back up to the trend line resistance area.
I would look for a reaction off the trendline and confirm a move downward.

1 Hour chart showing resistance to that area.

15 Minute chart showing that selling pressure. If price can fully break that 50ema and trendline, that should be confirmation to go short to the 1.04900 area.
Price did hit and touch the daily support zone for a double bottom.
Price came back up to the trend line resistance area.
I would look for a reaction off the trendline and confirm a move downward.
1 Hour chart showing resistance to that area.
15 Minute chart showing that selling pressure. If price can fully break that 50ema and trendline, that should be confirmation to go short to the 1.04900 area.
Trade active
In short position @1.07409. Currently up 45 pips.
Trade closed manually
Closed trade 1.07409 - 1.06891. Almost 52 pips. It might get caught at this level. On the 4HR chart price is meeting at the 50ema and 200ema.
Disclaimer
The information and publications are not meant to be, and do not constitute, financial, investment, trading, or other types of advice or recommendations supplied or endorsed by TradingView. Read more in the Terms of Use.
Disclaimer
The information and publications are not meant to be, and do not constitute, financial, investment, trading, or other types of advice or recommendations supplied or endorsed by TradingView. Read more in the Terms of Use.