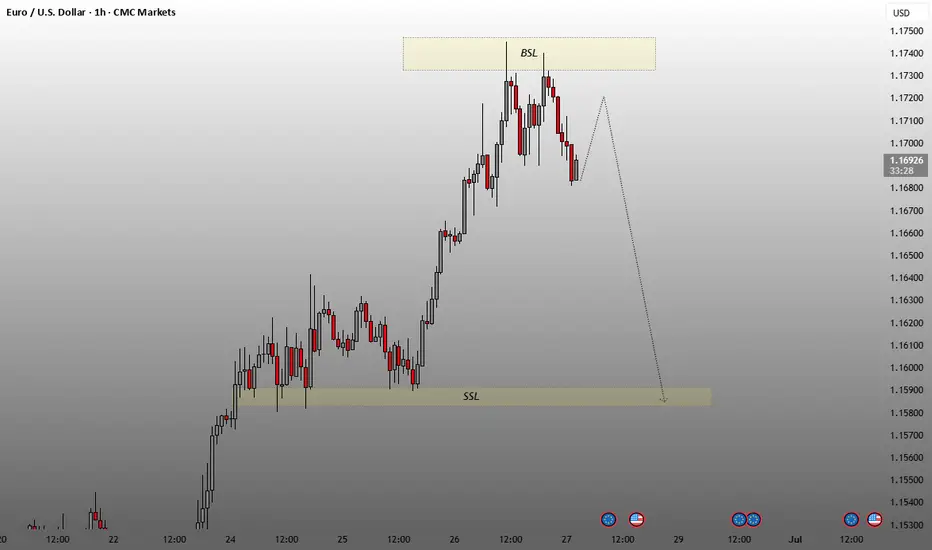
Symbol: EUR/USD
Timeframe: 1 hour
Price Range Displayed: ~1.15300 to ~1.17500
Current Price: 1.16935
🔍
Key Chart Markings
BSL (Buy-side Liquidity):
Marked at the top in the yellow zone (~1.17250–1.17500).
Indicates where buy-side liquidity was likely taken—suggesting liquidity grab or stop hunt.
SSL (Sell-side Liquidity):
Marked at the bottom yellow zone (~1.15700–1.15900).
Indicates a potential drawdown area—price may seek this liquidity next.
Price Action:
The price recently made a higher high into the BSL zone, followed by a bearish rejection.
A projected path is shown: short-term retracement upward, followed by a larger move downward toward the SSL zone.
📉
Potential Outlook (Bearish Bias)
The chart suggests a bearish move is anticipated:
BSL has been swept, signaling a reversal point.
Target: Sell-side liquidity around 1.15800, possibly lower.
⚙️
Technical Implication
This setup follows Smart Money Concepts (SMC) or Liquidity Engineering:
Liquidity is taken from one side of the market (BSL), and price is expected to move to the other (SSL).
Possible setup for a short trade after confirmation of the retracement.
Disclaimer
The information and publications are not meant to be, and do not constitute, financial, investment, trading, or other types of advice or recommendations supplied or endorsed by TradingView. Read more in the Terms of Use.
Disclaimer
The information and publications are not meant to be, and do not constitute, financial, investment, trading, or other types of advice or recommendations supplied or endorsed by TradingView. Read more in the Terms of Use.