Bearish rectangle
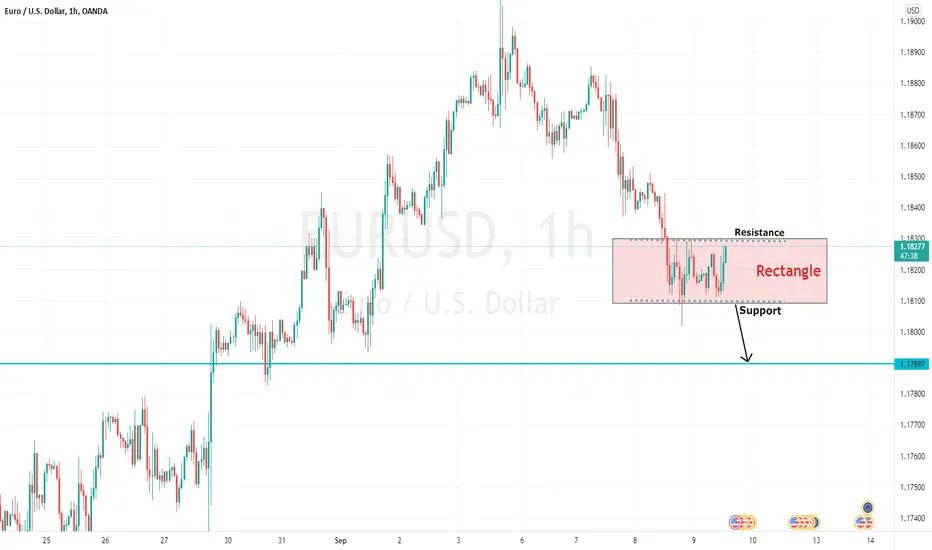
The bearish rectangle is a continuation pattern that occurs when a price pauses during a strong downtrend and temporarily bounces between two parallel levels before the trend continues. In this lesson, we will show you how to identify the bearish rectangle and use it as a possible selling opportunity....
The bearish rectangle is a continuation pattern that occurs when a price pauses during a strong downtrend and temporarily bounces between two parallel levels before the trend continues. In this lesson, we will show you how to identify the bearish rectangle and use it as a possible selling opportunity....
Disclaimer
The information and publications are not meant to be, and do not constitute, financial, investment, trading, or other types of advice or recommendations supplied or endorsed by TradingView. Read more in the Terms of Use.
Disclaimer
The information and publications are not meant to be, and do not constitute, financial, investment, trading, or other types of advice or recommendations supplied or endorsed by TradingView. Read more in the Terms of Use.