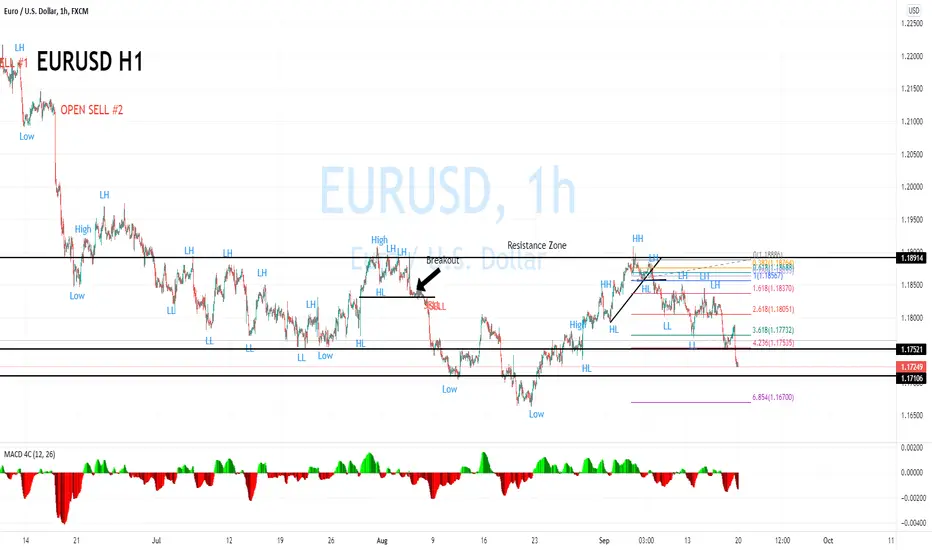
EURUSD on the 1H time-frame.
Steps:
1. The price still running downtrend by creating lower high and lower low and hit the Fibonacci level 423.6% at the same price of support zone.
2. The next target price is the Fibonacci level 685.4% and at the same level of support line is 1.16700
3. Trailing stop is working at 1.17888
4. MACD indicator still below the zero line.
Disclaimer
The information and publications are not meant to be, and do not constitute, financial, investment, trading, or other types of advice or recommendations supplied or endorsed by TradingView. Read more in the Terms of Use.
Disclaimer
The information and publications are not meant to be, and do not constitute, financial, investment, trading, or other types of advice or recommendations supplied or endorsed by TradingView. Read more in the Terms of Use.