🔻 Disruption Scenarios:
1. Resistance Zone at Target Level
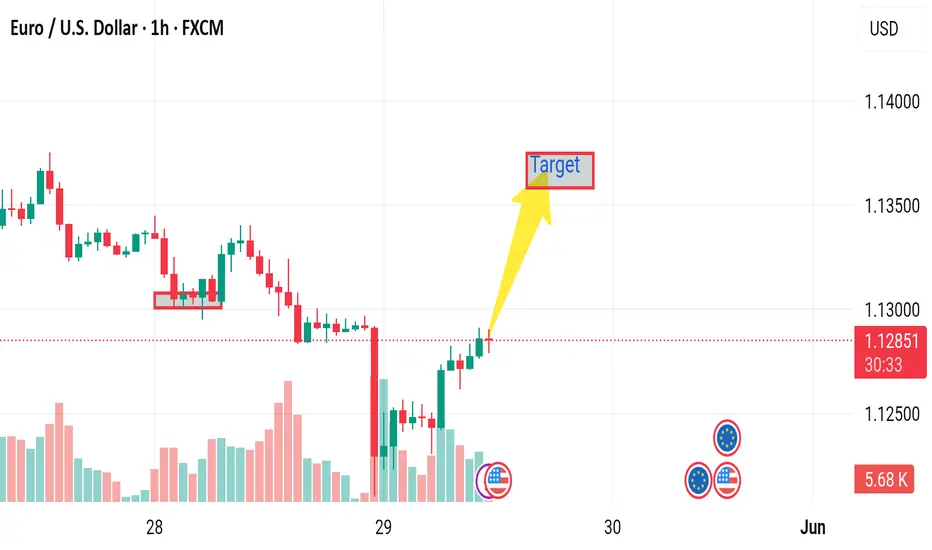
The marked "Target" could coincide with a strong resistance level from a previous high.
Price may reject this level again, forming a double top or bearish reversal candlestick pattern (e.g., shooting star or bearish engulfing).
2. Volume Divergence
The recent uptrend shows a slight drop in buying volume.
If price increases while volume decreases, it signals a potential exhaustion of bullish momentum.
3. Upcoming News Events (Fundamentals)
The chart shows several upcoming economic events (news icons).
Any negative surprise from U.S. data or positive Eurozone data could reverse the trend sharply.
For example, better-than-expected U.S. employment data could strengthen the USD, pushing EUR/USD down.
4. Overbought Condition
If we add an RSI (Relative Strength Index) or Stochastic oscillator, the price might already be in the overbought zone, suggesting a correction is due.
5. Fake Breakout Trap
If the price hits the “Target” but then fails to close above it, it could be a bull trap, triggering short positions and leading to a sharp sell-off.
1. Resistance Zone at Target Level
The marked "Target" could coincide with a strong resistance level from a previous high.
Price may reject this level again, forming a double top or bearish reversal candlestick pattern (e.g., shooting star or bearish engulfing).
2. Volume Divergence
The recent uptrend shows a slight drop in buying volume.
If price increases while volume decreases, it signals a potential exhaustion of bullish momentum.
3. Upcoming News Events (Fundamentals)
The chart shows several upcoming economic events (news icons).
Any negative surprise from U.S. data or positive Eurozone data could reverse the trend sharply.
For example, better-than-expected U.S. employment data could strengthen the USD, pushing EUR/USD down.
4. Overbought Condition
If we add an RSI (Relative Strength Index) or Stochastic oscillator, the price might already be in the overbought zone, suggesting a correction is due.
5. Fake Breakout Trap
If the price hits the “Target” but then fails to close above it, it could be a bull trap, triggering short positions and leading to a sharp sell-off.
t.me/gold_free_signals1
𝙁𝙤𝙧𝙚𝙭 𝙩𝙧𝙖𝙙𝙞𝙣𝙜 𝙚𝙭𝙥𝙚𝙧𝙞𝙚𝙣𝙘𝙚 𝙩𝙚𝙖𝙢 ☺️ 𝙢𝙖𝙣𝙖𝙜𝙚 𝙮𝙤𝙪𝙧 𝙖𝙘𝙘𝙤𝙪𝙣𝙩 𝙢𝙖𝙠𝙞𝙣𝙜 𝙢𝙤𝙣𝙚𝙮 🤑💰
t.me/gold_free_signals1
𝙁𝙤𝙧𝙚𝙭 𝙩𝙧𝙖𝙙𝙞𝙣𝙜 𝙚𝙭𝙥𝙚𝙧𝙞𝙚𝙣𝙘𝙚 𝙩𝙚𝙖𝙢 ☺️ 𝙢𝙖𝙣𝙖𝙜𝙚 𝙮𝙤𝙪𝙧 𝙖𝙘𝙘𝙤𝙪𝙣𝙩 𝙢𝙖𝙠𝙞𝙣𝙜 𝙢𝙤𝙣𝙚𝙮 🤑💰
t.me/gold_free_signals1
Disclaimer
The information and publications are not meant to be, and do not constitute, financial, investment, trading, or other types of advice or recommendations supplied or endorsed by TradingView. Read more in the Terms of Use.
t.me/gold_free_signals1
𝙁𝙤𝙧𝙚𝙭 𝙩𝙧𝙖𝙙𝙞𝙣𝙜 𝙚𝙭𝙥𝙚𝙧𝙞𝙚𝙣𝙘𝙚 𝙩𝙚𝙖𝙢 ☺️ 𝙢𝙖𝙣𝙖𝙜𝙚 𝙮𝙤𝙪𝙧 𝙖𝙘𝙘𝙤𝙪𝙣𝙩 𝙢𝙖𝙠𝙞𝙣𝙜 𝙢𝙤𝙣𝙚𝙮 🤑💰
t.me/gold_free_signals1
𝙁𝙤𝙧𝙚𝙭 𝙩𝙧𝙖𝙙𝙞𝙣𝙜 𝙚𝙭𝙥𝙚𝙧𝙞𝙚𝙣𝙘𝙚 𝙩𝙚𝙖𝙢 ☺️ 𝙢𝙖𝙣𝙖𝙜𝙚 𝙮𝙤𝙪𝙧 𝙖𝙘𝙘𝙤𝙪𝙣𝙩 𝙢𝙖𝙠𝙞𝙣𝙜 𝙢𝙤𝙣𝙚𝙮 🤑💰
t.me/gold_free_signals1
Disclaimer
The information and publications are not meant to be, and do not constitute, financial, investment, trading, or other types of advice or recommendations supplied or endorsed by TradingView. Read more in the Terms of Use.