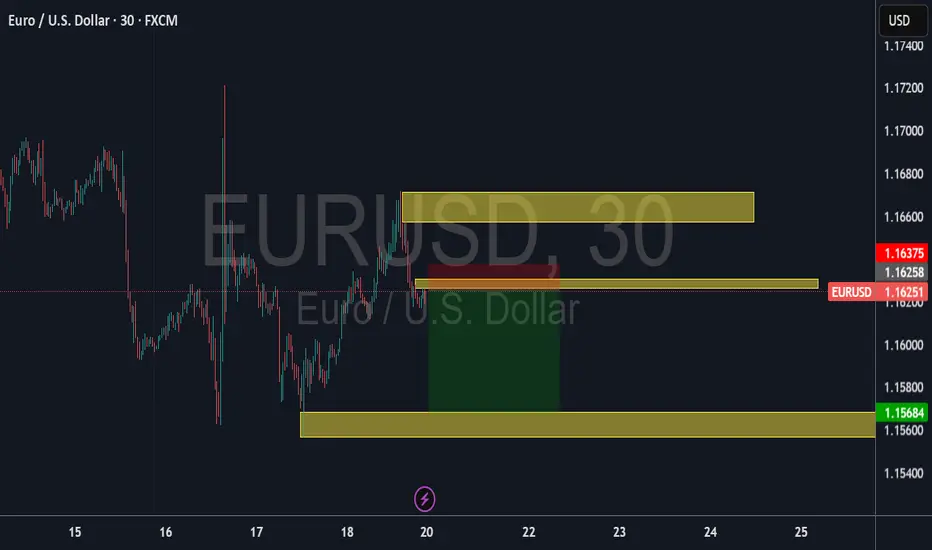
Currency Pair: Euro / U.S. Dollar (EUR/USD)
Timeframe: 30-minute intervals (H1)
Data Source: FXCM
Price Data:
Open: 1.16265
High: 1.16275
Low: 1.16189
Close: 1.16251
Change: -0.00014 (-0.01%)
Price Levels:
The chart displays price levels ranging from 1.17400 (highest) to 1.15400 (lowest), with the current price near 1.16251.
Notable levels include 1.16258 (near the close) and 1.15684 (support level).
Time Axis:
The horizontal axis shows time intervals, likely for July 20, 2025, with labels at 15, 16, 17, 18, 20, 22, 23, 24, and 25 (possibly representing hours in UTC).
Chart Type:
The chart appears to be a candlestick or line chart, though the specific type isn't visible in the provided data.
Observations:
The EUR/USD pair showed minimal movement during this period, with a slight decline of -0.01%.
The price traded in a tight range between 1.16189 (low) and 1.16275 (high).
The close (1.16251) was slightly below the open (1.16265), indicating minor bearish pressure.
Disclaimer
The information and publications are not meant to be, and do not constitute, financial, investment, trading, or other types of advice or recommendations supplied or endorsed by TradingView. Read more in the Terms of Use.
Disclaimer
The information and publications are not meant to be, and do not constitute, financial, investment, trading, or other types of advice or recommendations supplied or endorsed by TradingView. Read more in the Terms of Use.