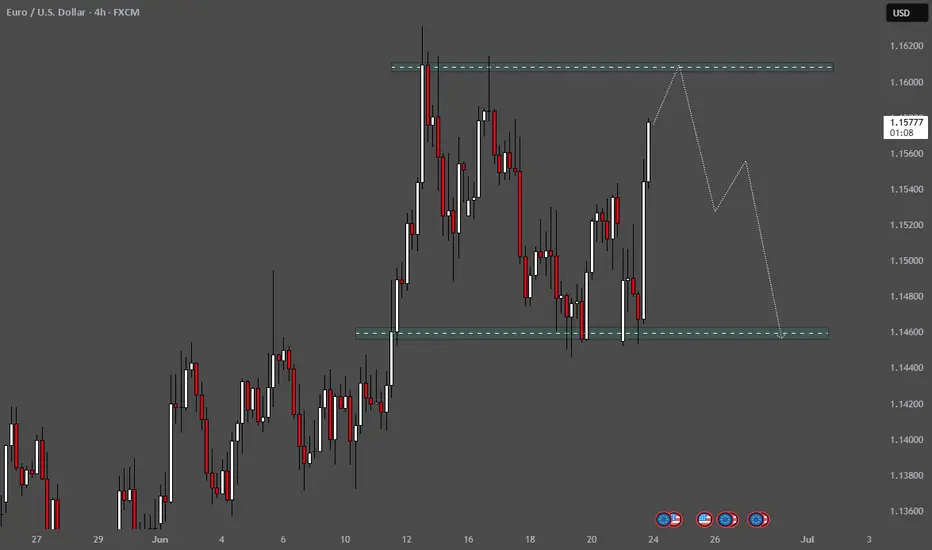
Resistance zone is marked near 1.16000.
Support zone is marked around 1.14500.
Price Action:
Price is currently near 1.15776, heading towards the resistance.
There’s a strong white candle indicating bullish momentum.
Projected Price Path:
A white projection line suggests a move upwards to test the resistance zone.
Then, a grey projection line suggests a potential reversal from the resistance, falling back to test the support level.
Interpretation:
This is likely a range-trading or false breakout trap analysis:
The trader is possibly expecting a fake breakout above the resistance before a drop back down toward the support area.
Disclaimer
The information and publications are not meant to be, and do not constitute, financial, investment, trading, or other types of advice or recommendations supplied or endorsed by TradingView. Read more in the Terms of Use.
Disclaimer
The information and publications are not meant to be, and do not constitute, financial, investment, trading, or other types of advice or recommendations supplied or endorsed by TradingView. Read more in the Terms of Use.