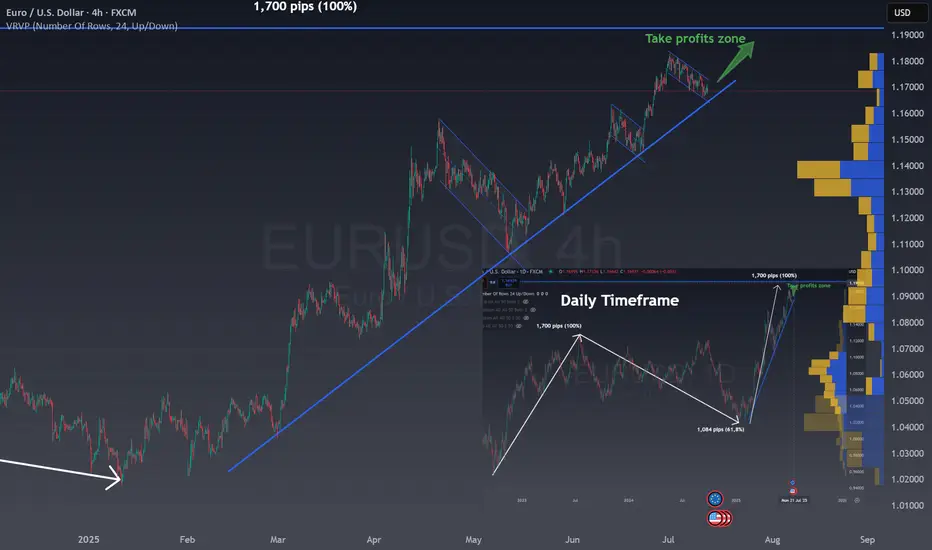
In the right bottom you can see the Daily chart for EUR/USD:
The MAIN CHART shows a clear uptrend for EURUSD and the current correction with a flag.
The combination of both patterns give us a clear BUY zone in the channel and using the trend as support or once the channel break upwards.
This is a very good risk reward ratio trade situation where all traders should be!
- The chart shows the EUR/USD on a daily timeframe.
- There was an initial strong rise of 1,700 pips, marked as a 100% move.
- After this, the price corrected downward by 1,084 pips, which is 61.8% of the previous rise.
- The 61.8% retracement is a common Fibonacci level, often signaling a reversal or pause.
- Now, the price is moving up again, following a similar path as the first rise.
- The chart suggests a possible new upward move of another 1,700 pips (100%).
- A "take profits zone" is marked at the top, indicating a target area for traders.
- This pattern reflects how markets often move in waves: trend, correction, and trend continuation.
- Fibonacci levels help traders identify potential reversal points.
- The chart is used to project future moves based on past price behavior.
The MAIN CHART shows a clear uptrend for EURUSD and the current correction with a flag.
The combination of both patterns give us a clear BUY zone in the channel and using the trend as support or once the channel break upwards.
This is a very good risk reward ratio trade situation where all traders should be!
Disclaimer
The information and publications are not meant to be, and do not constitute, financial, investment, trading, or other types of advice or recommendations supplied or endorsed by TradingView. Read more in the Terms of Use.
Disclaimer
The information and publications are not meant to be, and do not constitute, financial, investment, trading, or other types of advice or recommendations supplied or endorsed by TradingView. Read more in the Terms of Use.