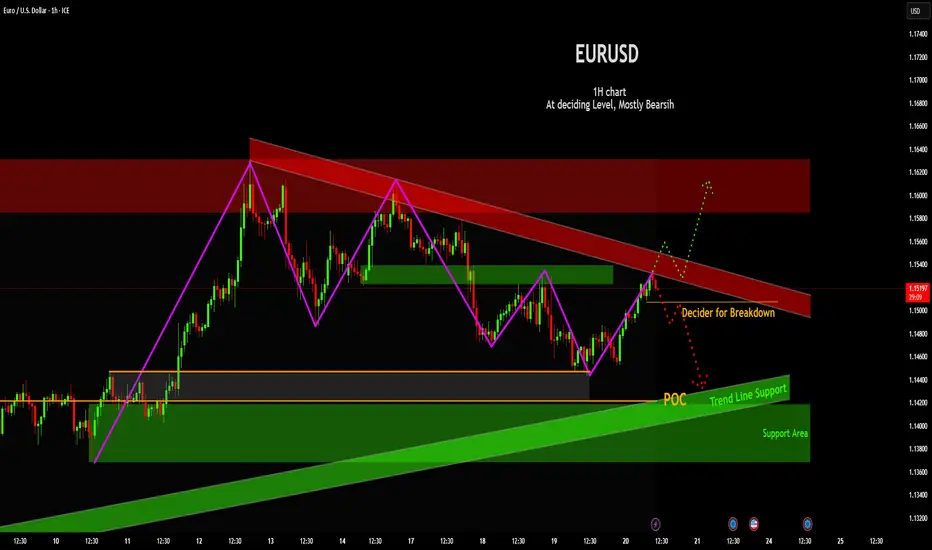
Current Price at Critical Resistance: The price action is currently challenging a significant downward-sloping resistance channel (highlighted in red). This zone has historically acted as a ceiling for price movements, and the current location is explicitly labeled as a "Decider for Breakdown," indicating a pivotal point for future direction.
Implied Bearish Bias: The overall sentiment indicated by the chart's title "At deciding Level, Mostly Bearish" suggests a lean towards downside continuation, although the price is currently pushing against resistance.
Identified Support Confluence: Below the current price, a layered support structure is identified. This includes an upward-sloping "Trend Line Support" channel (green) and a prominent horizontal "POC" (Point of Control), likely derived from volume profile analysis, both residing within a broader "Support Area" (green shaded zone).
Potential Future Pathways: Two immediate potential scenarios: a bearish continuation (red dotted path) if the current resistance holds and lower support levels are broken, or a bullish reversal (green dotted path) if the price successfully breaks above the descending resistance channel.
Swing Structure Visibility: Its kind of Flag and Pole pattern on larger picture, but there is also downward trending line. Purple line indicates the overall market structure interpretation.
Disclaimer:
The information provided in this chart is for educational and informational purposes only and should not be considered as investment advice. Trading and investing involve substantial risk and are not suitable for every investor. You should carefully consider your financial situation and consult with a financial advisor before making any investment decisions. The creator of this chart does not guarantee any specific outcome or profit and is not responsible for any losses incurred as a result of using this information. Past performance is not indicative of future results. Use this information at your own risk. This chart has been created for my own improvement in Trading and Investment Analysis. Please do your own analysis before any investments.
Disclaimer
The information and publications are not meant to be, and do not constitute, financial, investment, trading, or other types of advice or recommendations supplied or endorsed by TradingView. Read more in the Terms of Use.
Disclaimer
The information and publications are not meant to be, and do not constitute, financial, investment, trading, or other types of advice or recommendations supplied or endorsed by TradingView. Read more in the Terms of Use.