The EURUSD pair opened with a significant gap downwards in the aftermath of the first Tariff announcements between the U.S. and their strongest trade partners. This is a natural news reaction fundamentally but even from a technical standpoint, it is backed up.
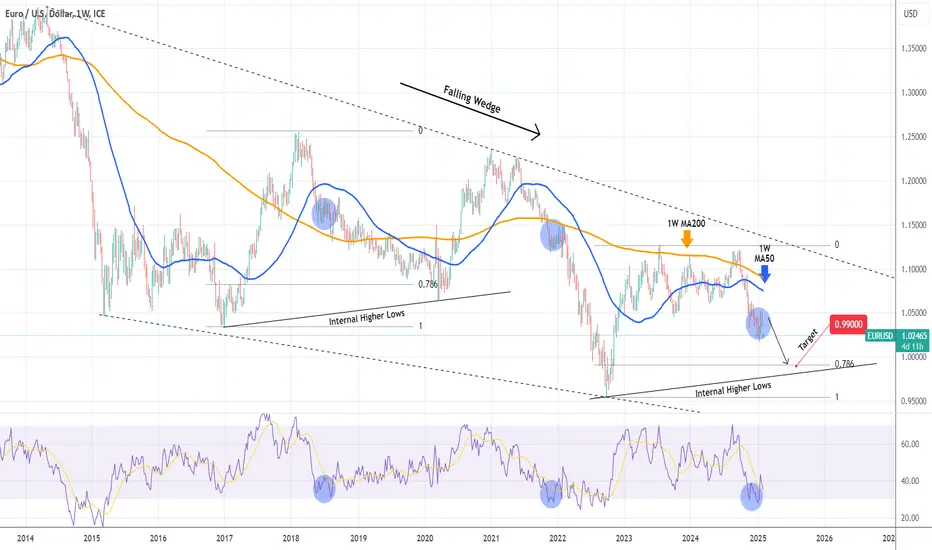
The reason is the massive 11-year Falling Wedge pattern that the pair has been trading in since May 2014. This pattern shows that after last September's Lower High and rejection below both the 1W MA200 (orange trend-line) and 1W MA50 (blue trend-line), we have started the new Bearish Leg.
With the 1W RSI making a somewhat Double Bottom on oversold territory (below 30.00), we see a similar pattern with the January 2022 and August 2018 fractals. Those sequences served as bearish continuation patterns following a consolidation phase.
The pair has consolidated through January and now this is the technical signal to resume the bearish trend potentially. The 2018 sequence declined to at least its 0.786 Fibonacci level before hitting the Internal Higher Lows trend-line.
This gives us a new bearish Target below parity at 0.99000, which is also contained above a potentially similar Higher Lows trend-line.
-------------------------------------------------------------------------------
** Please LIKE 👍, FOLLOW ✅, SHARE 🙌 and COMMENT ✍ if you enjoy this idea! Also share your ideas and charts in the comments section below! This is best way to keep it relevant, support us, keep the content here free and allow the idea to reach as many people as possible. **
-------------------------------------------------------------------------------
💸💸💸💸💸💸
👇 👇 👇 👇 👇 👇
👑Best Signals (Forex/Crypto+70% accuracy) & Account Management (+20% profit/month on 10k accounts)
💰Free Channel t.me/tradingshotglobal
🤵Contact info@tradingshot.com t.me/tradingshot
🔥New service: next X100 crypto GEMS!
💰Free Channel t.me/tradingshotglobal
🤵Contact info@tradingshot.com t.me/tradingshot
🔥New service: next X100 crypto GEMS!
Disclaimer
The information and publications are not meant to be, and do not constitute, financial, investment, trading, or other types of advice or recommendations supplied or endorsed by TradingView. Read more in the Terms of Use.