Technical Overview:
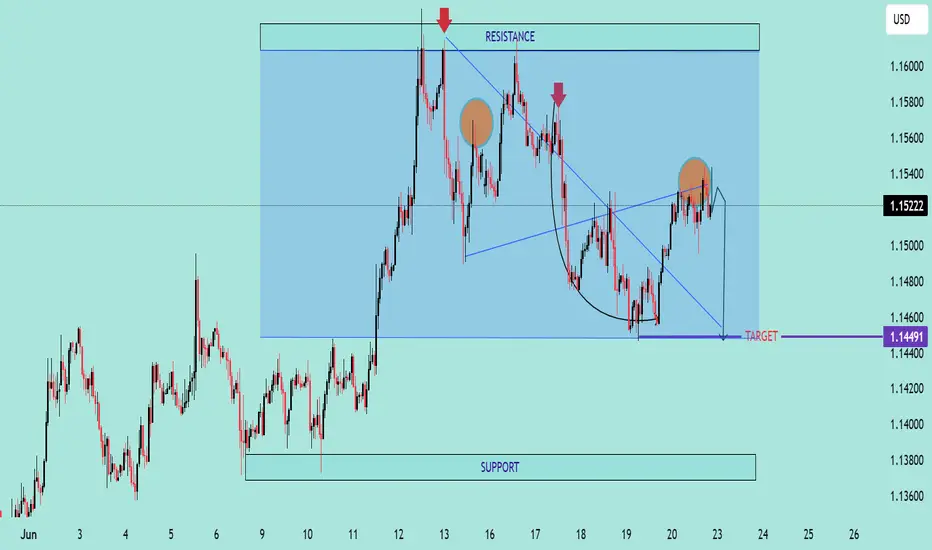
The EUR/USD chart exhibits signs of a bearish reversal pattern forming near a key resistance zone (1.15800 - 1.16000), highlighted with repeated rejection wicks (🔴 red arrows). Price is currently trading at 1.15222, after failing to hold above the neckline of the rounded bottom pattern.
🔍 Key Observations:
🔺 Resistance Zone: Strong resistance has been confirmed multiple times (red arrows), indicating sellers are active at the top.
🟠 Double Top / Head & Shoulders Behavior: Price action shows topping formations (highlighted with orange circles), suggesting exhaustion of bullish momentum.
📉 Bearish Breakdown Possibility:
Price rejected near neckline and is showing bearish candle formations.
Breakdown from the current consolidation zone could push price toward the target zone at 1.14491, marked in purple.
This aligns with previous support structure, reinforcing a technical downside projection.
🔻 Support Zone: Around 1.13800 - 1.14000 is a strong area of demand and may act as the next bounce point if the bearish move continues.
📐 Chart Pattern Structure:
Rounded bottom formed earlier, but the failure to continue higher and breakout suggests a false breakout trap for buyers.
Downward sloping trendline broke, but now price is struggling to sustain above previous highs.
📌 Conclusion:
⚠️ Caution for bulls as price shows signs of weakness at resistance. A move below 1.15000 may initiate further downside toward 1.14491 and possibly lower. Short-term traders can watch for confirmation candles near this zone for entries.
📅 Short-Term Bias: Bearish
🎯 Target: 1.14491
⛔️ Invalidation: Strong breakout above 1.16000
JOIN MY TELEGRAM CHANNEL
t.me/StellarMarketAnalysis
JOIN MY RECOMMENTED BROKER REFFREL LINK
⤵️one.exnesstrack.net/a/uvd1etcgg1
PARTNER CODE⤵️
uvd1etcgg1
t.me/StellarMarketAnalysis
JOIN MY RECOMMENTED BROKER REFFREL LINK
⤵️one.exnesstrack.net/a/uvd1etcgg1
PARTNER CODE⤵️
uvd1etcgg1
Disclaimer
The information and publications are not meant to be, and do not constitute, financial, investment, trading, or other types of advice or recommendations supplied or endorsed by TradingView. Read more in the Terms of Use.