🔁 EUR/USD – Weekly AMD Cycle Repeating? 📉
Pair: EUR/USD
Timeframe: Weekly
Bias: Bearish (Mid-Cycle Distribution)
🧠 What Is the AMD Cycle?
The AMD Cycle is a 3-phase smart money model used to describe how price moves through:
Accumulation – Smart money loads up on positions in discount zones.
Manipulation – Stop hunts / false breakouts to mislead retail.
Distribution – Price delivers to target efficiently, often with trend continuation.
This cycle repeats over and over across all timeframes – and right now, EUR/USD is showing a textbook repeat of this pattern on the weekly chart.
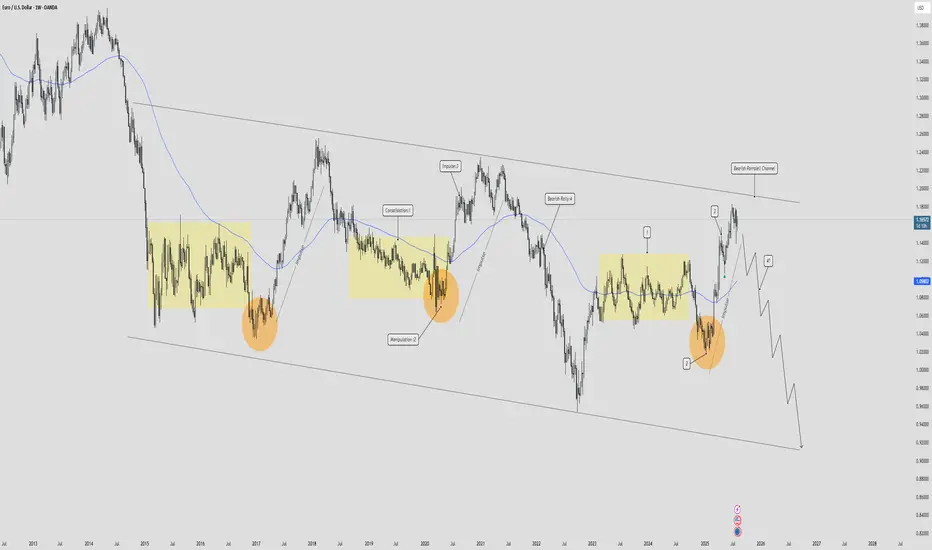
📊 EUR/USD Weekly – AMD Breakdown
✅ Phase 1: Accumulation (Late 2022 – Mid 2023)
Price bottomed out in the 0.95 - 1.00 zone, creating multiple equal lows, acting as liquidity.
Smart money accumulated orders here, absorbing sell pressure.
✅ Phase 2: Manipulation (Q3 2023 – Early 2024)
Price created a massive bullish rally, sweeping highs around 1.10 – 1.12, triggering breakout buyers.
This was liquidity engineering, not genuine bullish continuation.
We saw divergent volume, overextended price, and imbalance being left behind.
✅ Phase 3: Distribution (Mid 2024 – Now)
After sweeping the highs, price has shifted structure.
Multiple weekly BOS (Breaks of Structure) confirm a bearish reversal.
Price is now returning to retest premium zones near 1.09 – 1.10, likely to distribute further before sell-off.
Pair: EUR/USD
Timeframe: Weekly
Bias: Bearish (Mid-Cycle Distribution)
🧠 What Is the AMD Cycle?
The AMD Cycle is a 3-phase smart money model used to describe how price moves through:
Accumulation – Smart money loads up on positions in discount zones.
Manipulation – Stop hunts / false breakouts to mislead retail.
Distribution – Price delivers to target efficiently, often with trend continuation.
This cycle repeats over and over across all timeframes – and right now, EUR/USD is showing a textbook repeat of this pattern on the weekly chart.
📊 EUR/USD Weekly – AMD Breakdown
✅ Phase 1: Accumulation (Late 2022 – Mid 2023)
Price bottomed out in the 0.95 - 1.00 zone, creating multiple equal lows, acting as liquidity.
Smart money accumulated orders here, absorbing sell pressure.
✅ Phase 2: Manipulation (Q3 2023 – Early 2024)
Price created a massive bullish rally, sweeping highs around 1.10 – 1.12, triggering breakout buyers.
This was liquidity engineering, not genuine bullish continuation.
We saw divergent volume, overextended price, and imbalance being left behind.
✅ Phase 3: Distribution (Mid 2024 – Now)
After sweeping the highs, price has shifted structure.
Multiple weekly BOS (Breaks of Structure) confirm a bearish reversal.
Price is now returning to retest premium zones near 1.09 – 1.10, likely to distribute further before sell-off.
Disclaimer
The information and publications are not meant to be, and do not constitute, financial, investment, trading, or other types of advice or recommendations supplied or endorsed by TradingView. Read more in the Terms of Use.
Disclaimer
The information and publications are not meant to be, and do not constitute, financial, investment, trading, or other types of advice or recommendations supplied or endorsed by TradingView. Read more in the Terms of Use.