🧱 Supply and Demand Zones
Supply Zones (Red/Orange boxes):
1.13996 - 1.13812: Major untested supply; strong selling pressure expected.
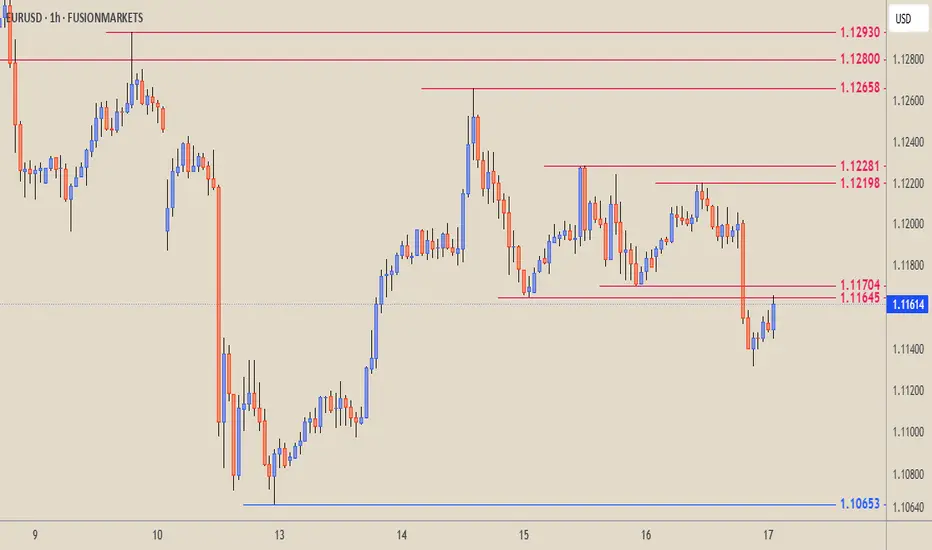
1.12930 - 1.12658: Cluster of supply zones; significant resistance area.
1.12281 - 1.12198: Recently formed supply, tested once.
1.11704 - 1.11645: Currently active supply zone; price just rejected this level.
Demand Zone (Blue box):
1.10653: Strong demand zone from previous swing low; price bounced significantly here on May 13.
🔍 Trend and Price Action
Trend: Short-term bearish.
Price has made lower highs and lower lows.
A large bearish impulse drop occurred between May 13 and 14.
Minor consolidation is forming after the recent drop.
Current Price: Around 1.11614 — just below a supply zone (1.11704 - 1.11645) and under the influence of selling pressure.
Recent Reaction:
The price attempted to move up but was rejected at the supply zone.
Now pulling back and potentially targeting lower demand levels.
🔄 Key Levels to Watch
Resistance:
1.11704 - 1.11645 (Immediate)
1.12281
1.12800
Support:
1.10653 (Major Demand)
Intermediate minor supports may form during the descent.
📈 Potential Scenarios
Bearish Continuation:
Price may continue lower towards the demand zone at 1.10653.
If this level breaks, it could lead to further downside, possibly forming new demand.
Bullish Reversal:
If price breaks and holds above 1.11704, the next test could be the 1.12198 - 1.12281 supply zone.
Bullish confirmation would require breaking 1.12930 with strength.
🧠 Summary
Market structure favors short-term bears.
Strong supply zones are capping upside.
The key demand at 1.10653 is the next potential support.
Traders may look for short entries near supply and long opportunities near demand, depending on confirmation and context.
Supply Zones (Red/Orange boxes):
1.13996 - 1.13812: Major untested supply; strong selling pressure expected.
1.12930 - 1.12658: Cluster of supply zones; significant resistance area.
1.12281 - 1.12198: Recently formed supply, tested once.
1.11704 - 1.11645: Currently active supply zone; price just rejected this level.
Demand Zone (Blue box):
1.10653: Strong demand zone from previous swing low; price bounced significantly here on May 13.
🔍 Trend and Price Action
Trend: Short-term bearish.
Price has made lower highs and lower lows.
A large bearish impulse drop occurred between May 13 and 14.
Minor consolidation is forming after the recent drop.
Current Price: Around 1.11614 — just below a supply zone (1.11704 - 1.11645) and under the influence of selling pressure.
Recent Reaction:
The price attempted to move up but was rejected at the supply zone.
Now pulling back and potentially targeting lower demand levels.
🔄 Key Levels to Watch
Resistance:
1.11704 - 1.11645 (Immediate)
1.12281
1.12800
Support:
1.10653 (Major Demand)
Intermediate minor supports may form during the descent.
📈 Potential Scenarios
Bearish Continuation:
Price may continue lower towards the demand zone at 1.10653.
If this level breaks, it could lead to further downside, possibly forming new demand.
Bullish Reversal:
If price breaks and holds above 1.11704, the next test could be the 1.12198 - 1.12281 supply zone.
Bullish confirmation would require breaking 1.12930 with strength.
🧠 Summary
Market structure favors short-term bears.
Strong supply zones are capping upside.
The key demand at 1.10653 is the next potential support.
Traders may look for short entries near supply and long opportunities near demand, depending on confirmation and context.
Disclaimer
The information and publications are not meant to be, and do not constitute, financial, investment, trading, or other types of advice or recommendations supplied or endorsed by TradingView. Read more in the Terms of Use.
Disclaimer
The information and publications are not meant to be, and do not constitute, financial, investment, trading, or other types of advice or recommendations supplied or endorsed by TradingView. Read more in the Terms of Use.