Not taking too many data from the past.
Technical analysis using candlesticks
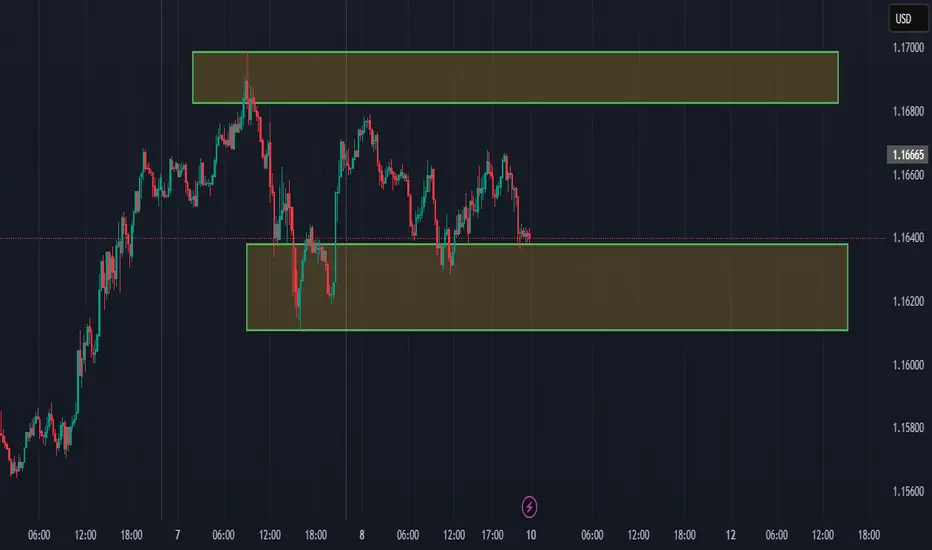
Daily timeframe = Last five (5) candles... Market is bullish
H4 = sub structure of D1 last Friday candle is bearish. Marked current LH and Last LL.
Market currently finding it hard to form a new LL
WILL THERE BE ACONTINUATION TO THE DOWNSIDE OR WILL MARKET START FORMING HL AND GET A NEW HH.
Technical analysis using candlesticks
Daily timeframe = Last five (5) candles... Market is bullish
H4 = sub structure of D1 last Friday candle is bearish. Marked current LH and Last LL.
Market currently finding it hard to form a new LL
WILL THERE BE ACONTINUATION TO THE DOWNSIDE OR WILL MARKET START FORMING HL AND GET A NEW HH.
Disclaimer
The information and publications are not meant to be, and do not constitute, financial, investment, trading, or other types of advice or recommendations supplied or endorsed by TradingView. Read more in the Terms of Use.
Disclaimer
The information and publications are not meant to be, and do not constitute, financial, investment, trading, or other types of advice or recommendations supplied or endorsed by TradingView. Read more in the Terms of Use.