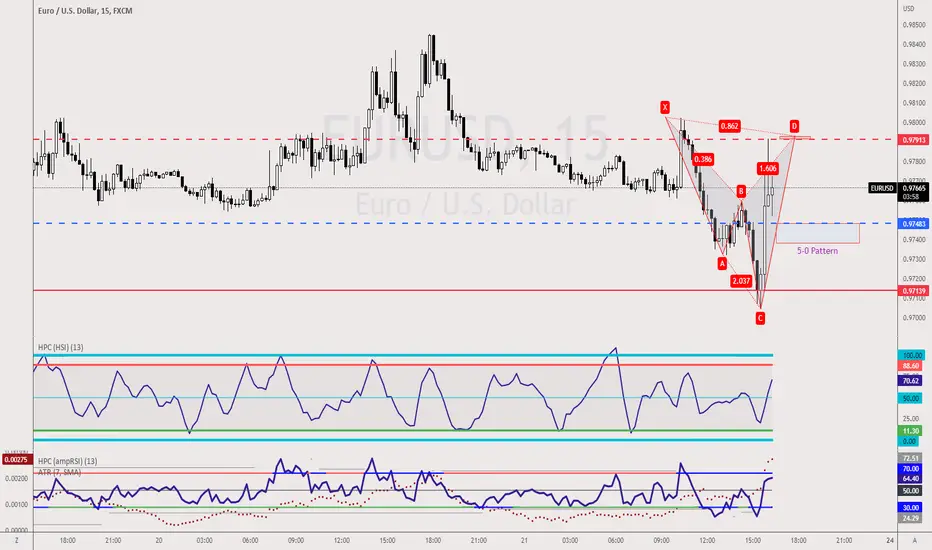
Well, if you guys are aware, I do not usually post an analysis based on M15 timeframe, but this setup is worth watching. The distance between the red and blue line is 43pips, substantial profit between the 2 levels.
On the red dotted line, come the completion of the Bearish Shark Pattern and the blue dotted line, Bullish 5-0 Pattern.
Candlestick Pattern confirmation is required before one consider it as an trading ideas.
p/s do your own analysis and never follow blindly
On the red dotted line, come the completion of the Bearish Shark Pattern and the blue dotted line, Bullish 5-0 Pattern.
Candlestick Pattern confirmation is required before one consider it as an trading ideas.
p/s do your own analysis and never follow blindly
🕒 15mins workday for Young Parents
🏦 Qualify Junior Analyst within 90days
🎤 Keynote Speaker
Get into our 15mins workday community
discord.gg/AKDr9vPqH7
Live session & Trading Tips on the GO
instagram.com/raynlim/
🏦 Qualify Junior Analyst within 90days
🎤 Keynote Speaker
Get into our 15mins workday community
discord.gg/AKDr9vPqH7
Live session & Trading Tips on the GO
instagram.com/raynlim/
Disclaimer
The information and publications are not meant to be, and do not constitute, financial, investment, trading, or other types of advice or recommendations supplied or endorsed by TradingView. Read more in the Terms of Use.