🔍 Disruption Analysis of the EUR/USD Chart
1. "Support" Label Positioned at the Current Price Level
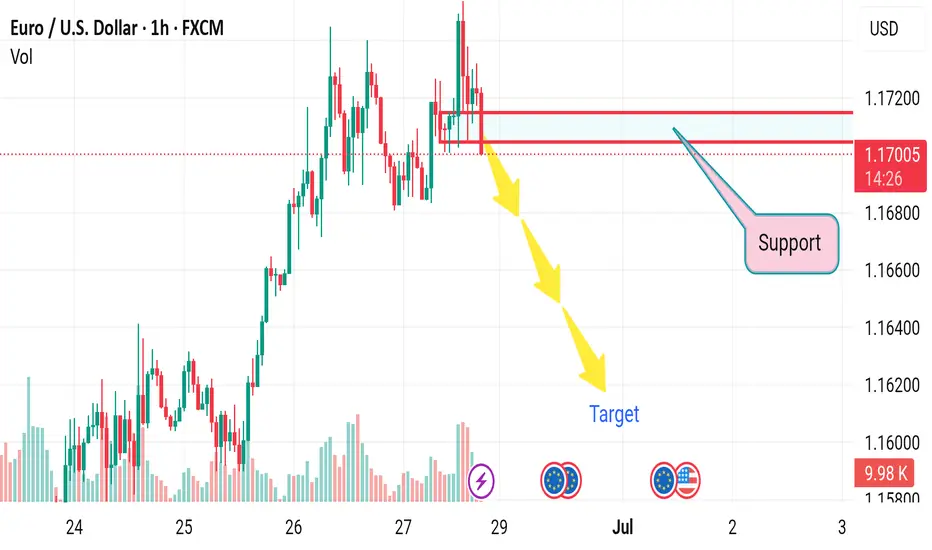
Disruption: The chart marks 1.1705 as “Support,” but price is sitting directly on or slightly above it.
Challenge: If price is already breaking through or hovering at support without bouncing, it’s a sign of weakness — this zone may no longer be valid as support.
✅ Correction: Re-label this area as “Potential Resistance” if a breakdown confirms.
---
2. Directional Bias Assumes Continuation Without Confirmation
Disruption: Three yellow arrows indicate a bearish continuation, yet no bearish candlestick pattern, volume spike, or break-close-below-support has been confirmed.
Challenge: This is a premature projection that lacks price action validation.
✅ Correction: Wait for a confirmed candle close below 1.1700 with increased volume to validate the move.
---
3. Volume Ignored Despite Clear Clues
Disruption: There is rising volume during the move down near support — this could indicate either strong selling or smart money accumulation.
Challenge: Volume analysis is completely overlooked, missing a critical layer of confirmation.
✅ Correction: Analyze the volume spike on the red candles; if followed by weak follow-through, a bullish reversal may be setting up instead
1. "Support" Label Positioned at the Current Price Level
Disruption: The chart marks 1.1705 as “Support,” but price is sitting directly on or slightly above it.
Challenge: If price is already breaking through or hovering at support without bouncing, it’s a sign of weakness — this zone may no longer be valid as support.
✅ Correction: Re-label this area as “Potential Resistance” if a breakdown confirms.
---
2. Directional Bias Assumes Continuation Without Confirmation
Disruption: Three yellow arrows indicate a bearish continuation, yet no bearish candlestick pattern, volume spike, or break-close-below-support has been confirmed.
Challenge: This is a premature projection that lacks price action validation.
✅ Correction: Wait for a confirmed candle close below 1.1700 with increased volume to validate the move.
---
3. Volume Ignored Despite Clear Clues
Disruption: There is rising volume during the move down near support — this could indicate either strong selling or smart money accumulation.
Challenge: Volume analysis is completely overlooked, missing a critical layer of confirmation.
✅ Correction: Analyze the volume spike on the red candles; if followed by weak follow-through, a bullish reversal may be setting up instead
t.me/gold_free_signals1
𝙁𝙤𝙧𝙚𝙭 𝙩𝙧𝙖𝙙𝙞𝙣𝙜 𝙚𝙭𝙥𝙚𝙧𝙞𝙚𝙣𝙘𝙚 𝙩𝙚𝙖𝙢 ☺️ 𝙢𝙖𝙣𝙖𝙜𝙚 𝙮𝙤𝙪𝙧 𝙖𝙘𝙘𝙤𝙪𝙣𝙩 𝙢𝙖𝙠𝙞𝙣𝙜 𝙢𝙤𝙣𝙚𝙮 🤑💰
t.me/gold_free_signals1
𝙁𝙤𝙧𝙚𝙭 𝙩𝙧𝙖𝙙𝙞𝙣𝙜 𝙚𝙭𝙥𝙚𝙧𝙞𝙚𝙣𝙘𝙚 𝙩𝙚𝙖𝙢 ☺️ 𝙢𝙖𝙣𝙖𝙜𝙚 𝙮𝙤𝙪𝙧 𝙖𝙘𝙘𝙤𝙪𝙣𝙩 𝙢𝙖𝙠𝙞𝙣𝙜 𝙢𝙤𝙣𝙚𝙮 🤑💰
t.me/gold_free_signals1
Disclaimer
The information and publications are not meant to be, and do not constitute, financial, investment, trading, or other types of advice or recommendations supplied or endorsed by TradingView. Read more in the Terms of Use.
t.me/gold_free_signals1
𝙁𝙤𝙧𝙚𝙭 𝙩𝙧𝙖𝙙𝙞𝙣𝙜 𝙚𝙭𝙥𝙚𝙧𝙞𝙚𝙣𝙘𝙚 𝙩𝙚𝙖𝙢 ☺️ 𝙢𝙖𝙣𝙖𝙜𝙚 𝙮𝙤𝙪𝙧 𝙖𝙘𝙘𝙤𝙪𝙣𝙩 𝙢𝙖𝙠𝙞𝙣𝙜 𝙢𝙤𝙣𝙚𝙮 🤑💰
t.me/gold_free_signals1
𝙁𝙤𝙧𝙚𝙭 𝙩𝙧𝙖𝙙𝙞𝙣𝙜 𝙚𝙭𝙥𝙚𝙧𝙞𝙚𝙣𝙘𝙚 𝙩𝙚𝙖𝙢 ☺️ 𝙢𝙖𝙣𝙖𝙜𝙚 𝙮𝙤𝙪𝙧 𝙖𝙘𝙘𝙤𝙪𝙣𝙩 𝙢𝙖𝙠𝙞𝙣𝙜 𝙢𝙤𝙣𝙚𝙮 🤑💰
t.me/gold_free_signals1
Disclaimer
The information and publications are not meant to be, and do not constitute, financial, investment, trading, or other types of advice or recommendations supplied or endorsed by TradingView. Read more in the Terms of Use.