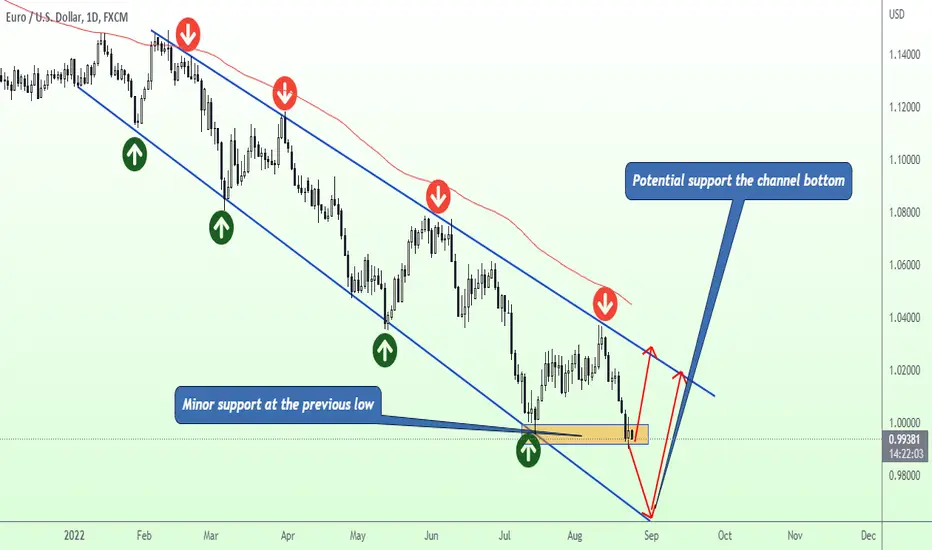
EUR/USD is in a continuous downtrend since last year. And since February this year, EUR/USD
is moving back and forth in a downward channel as you can see in the chart.
The downward channel is defined by clear upper and lower trend lines which as acting as resistance
and support respectively.
Yesterday, we saw a bullish candlestick in the daily chart at the previous low, which might be of significance.
Price may rally towards the 1.0250 level if the minor support holds.
However, there is also a likelihood that price may break this minor support and drop towards 0.9670 and
then rebound to 1.02. Traders must consider both these scenarios before placing their orders. If you
are trying to buy now, buy as close to the 0.99 level and use a stop loss to keep your risk low.
Disclaimer
The information and publications are not meant to be, and do not constitute, financial, investment, trading, or other types of advice or recommendations supplied or endorsed by TradingView. Read more in the Terms of Use.
Disclaimer
The information and publications are not meant to be, and do not constitute, financial, investment, trading, or other types of advice or recommendations supplied or endorsed by TradingView. Read more in the Terms of Use.