Find TDIGM under indicator search
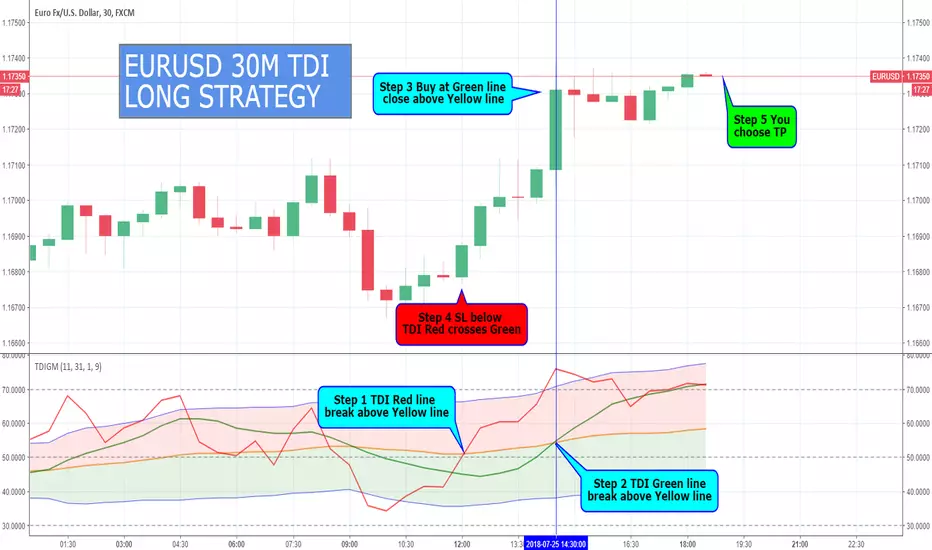
Step #1: Look for the Read Line to break above the Yellow Line
The yellow line is regarded as being the most important line of the TDI indicator because it binds together all the other parts and it makes the indicator tradable. Traders also refer to the yellow line as the Market Base line.
The yellow line can be used to determine the long-term trend. We need to see an alignment between the long-term trend and the short-term trend in order to successfully scalp the market.
When we have positive expectation coming into the market, the red line must be above the green and the yellow line. That’s the first signal that the buyers are stepping into the market.
Step #2: Wait for the Green Line to also break above the Yellow Line. The Red Line must not break above the upper blue band.
The second required condition for a valid trade signal is to also wait for the green line to break above the yellow line. Once this happens, we have an alignment between the short-term trend and the long-term trend.
When an alignment in the trend direction occurs, that’s when we have those explosive scalping opportunities.
The catch is that we need the red line to be contained inside the blue Bollinger Bands. When the red line breaks the upper blue band, we know the market is stepping on the gas. This means we have an acceleration in volatility and tells us that the buyers are exhausted.
We don’t want that to happen!
Step #3: Buy at the closing candle after the Green Line breaks above the Yellow Line
When the green line crosses above the yellow line, it tells us that the buyers are buying and the fact that we have positive sentiment.
We’re looking to buy in a market with increasing volatility and in a market where both the short-term and the long-term trend align in the same upward direction.
When the price and the market sentiment align, and they are sharing the same sort of expectation, then that’s the best time to enter the market. So, we buy at the closing candle after the green line crosses above the yellow line.
Step #4: Hide your protective Stop Loss below the respective swing low developed as a result of the red line crossing above the green line.
Find on the chart the last time the red line crossed above the green line and located on the price chart the respective swing low developed as a result of this crossover.
Now, use this swing low to hide your protective stop loss.
Step #5: You choose Take profit or when both the red line and the green line crosses above the 70 level
The real reversal signal is given when the green line also joins the red line and touches the 70 level which signals buyer exhaustion again. When this happens, we want to take profits.
The expectation is that when we get up to these levels to start looking for market reversal because the market it can’t go any higher. And this is the perfect place to get out of our scalping trade and take profits.
Note** the above was an example of a BUY trade using the best traders dynamic index strategy. Use the same rules for a SELL trade – but in reverse.
Disclaimer
The information and publications are not meant to be, and do not constitute, financial, investment, trading, or other types of advice or recommendations supplied or endorsed by TradingView. Read more in the Terms of Use.
Disclaimer
The information and publications are not meant to be, and do not constitute, financial, investment, trading, or other types of advice or recommendations supplied or endorsed by TradingView. Read more in the Terms of Use.