Hello Birdies,
First lets talk about chart:
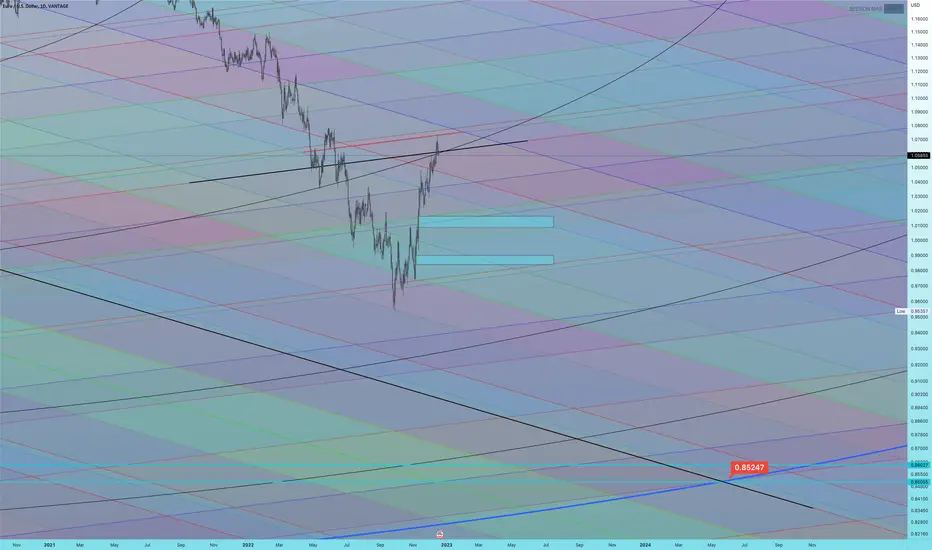
So in long run we are seeing EUR @ 0.85-0.88 as per chart the time will be around May-Aug 2024
First lets talk about chart:
- We have two black lines on chart there history will be posted in comment as screenshot
- The red line + black line + circle is providing strong resistance and price already fallback inside the circle
- There is a lot of liquidity in terms of imbalances
So in long run we are seeing EUR @ 0.85-0.88 as per chart the time will be around May-Aug 2024
Note
The black and red line is coming from ATL of the pair and now price converted and confirmed it as a resistanceNote
The other black line is what EUR trying to convert it into support since 2008. Once converted we will see a boom in EURUSD after that. The time span this spread over is from May to Nov 2024💎 Let's Connect:
👑 Telegram - t.me/blackbirdtradin
👑 Discord - discord.com/invite/427un9969m
👑 Telegram - t.me/blackbirdtradin
👑 Discord - discord.com/invite/427un9969m
Related publications
Disclaimer
The information and publications are not meant to be, and do not constitute, financial, investment, trading, or other types of advice or recommendations supplied or endorsed by TradingView. Read more in the Terms of Use.
💎 Let's Connect:
👑 Telegram - t.me/blackbirdtradin
👑 Discord - discord.com/invite/427un9969m
👑 Telegram - t.me/blackbirdtradin
👑 Discord - discord.com/invite/427un9969m
Related publications
Disclaimer
The information and publications are not meant to be, and do not constitute, financial, investment, trading, or other types of advice or recommendations supplied or endorsed by TradingView. Read more in the Terms of Use.