Hello friends
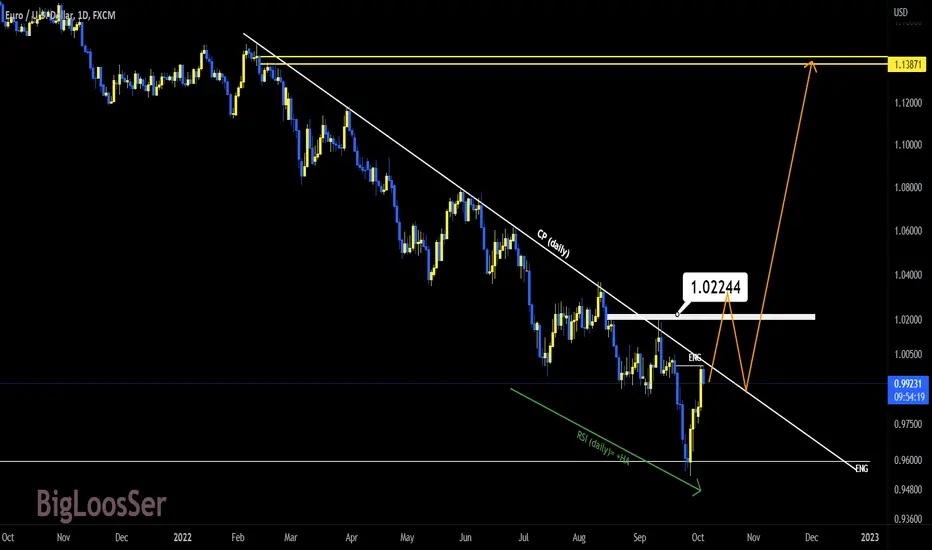
On the daily chart , we have a kind of tight movement, the positive divergence of the RSI can be a kind of signal for the price to exit from the upper side, from this compression.
Provided that the current price trend is above the range of $1.02244, the possibility of the continuation of the upward trend up to the yellow range ($1.13871) will be strengthened.
What do you think?
Trade active
It seems that there is a high probability that we will get out of this compression from aboveDisclaimer
The information and publications are not meant to be, and do not constitute, financial, investment, trading, or other types of advice or recommendations supplied or endorsed by TradingView. Read more in the Terms of Use.
Disclaimer
The information and publications are not meant to be, and do not constitute, financial, investment, trading, or other types of advice or recommendations supplied or endorsed by TradingView. Read more in the Terms of Use.
